Observability Migrations That Don't Hand You a Surprise Query Bill
Small teams leaving a hosted observability vendor often trade a data bill for a query bill. How to migrate to Grafana/Prometheus/Loki without metering yourself into the same trap.
Small teams leave a hosted observability vendor to escape an unpredictable bill — and a surprising number land somewhere just as expensive, because they self-hosted the storage but not the discipline. The hosted bill was metered on ingest and queries; a careless self-hosted stack just moves the cost to disk, RAM, and a Grafana that times out on every dashboard. Migrating well means planning retention, cardinality, and sampling before you flip, not after the volume explodes.
The cost just changes shape
Hosted observability charges for data in and questions asked. Self-hosted doesn't bill you — but unbounded metrics cardinality eats RAM, unbounded logs eat disk, and unbounded retention eats both forever. The "surprise query bill" becomes a "Prometheus OOM'd again" and a 500 GB Loki volume. Same problem, different invoice. Plan the limits up front.
Lever 1: retention by signal, not one global number
Not every signal deserves the same lifespan:
- High-resolution metrics — keep days to weeks; downsample older data rather than storing raw forever.
- Logs — the biggest volume; keep recent logs hot and short, archive or drop the rest. Decide how far back an incident could hide and keep exactly that.
- Long-term trends — keep cheap downsampled rollups, not raw points.
Lever 2: control metric cardinality
Cardinality — the number of unique label combinations — is what actually kills self-hosted Prometheus. A label like user_id or request_id multiplies series into the millions and the RAM follows. Keep labels bounded (status, route-class, instance), never unbounded identifiers. This one discipline prevents most self-hosted metrics blowups.
Lever 3: sample and scope logs
You rarely need every debug line forever. Sample high-volume logs, scope levels (info+ in prod, not debug), and route only what you'll actually query into the indexed store. Loki's label discipline mirrors Prometheus's: index a few labels, not the log contents.
Lever 4: size the box for the real volume
Once retention and cardinality are bounded, size the host honestly — and benchmark it for real rather than trusting specs, because observability is RAM- and IO-hungry. Set memory limits so the stack can't take the whole box, the same resource discipline every heavy service needs.
Don't rebuild what alerting already solved
Observability isn't only dashboards — it's the path to a human. Reuse the low-noise uptime-check approach and the alerting last-mile fixes rather than wiring noisy alerts off raw metrics.
See it in one place
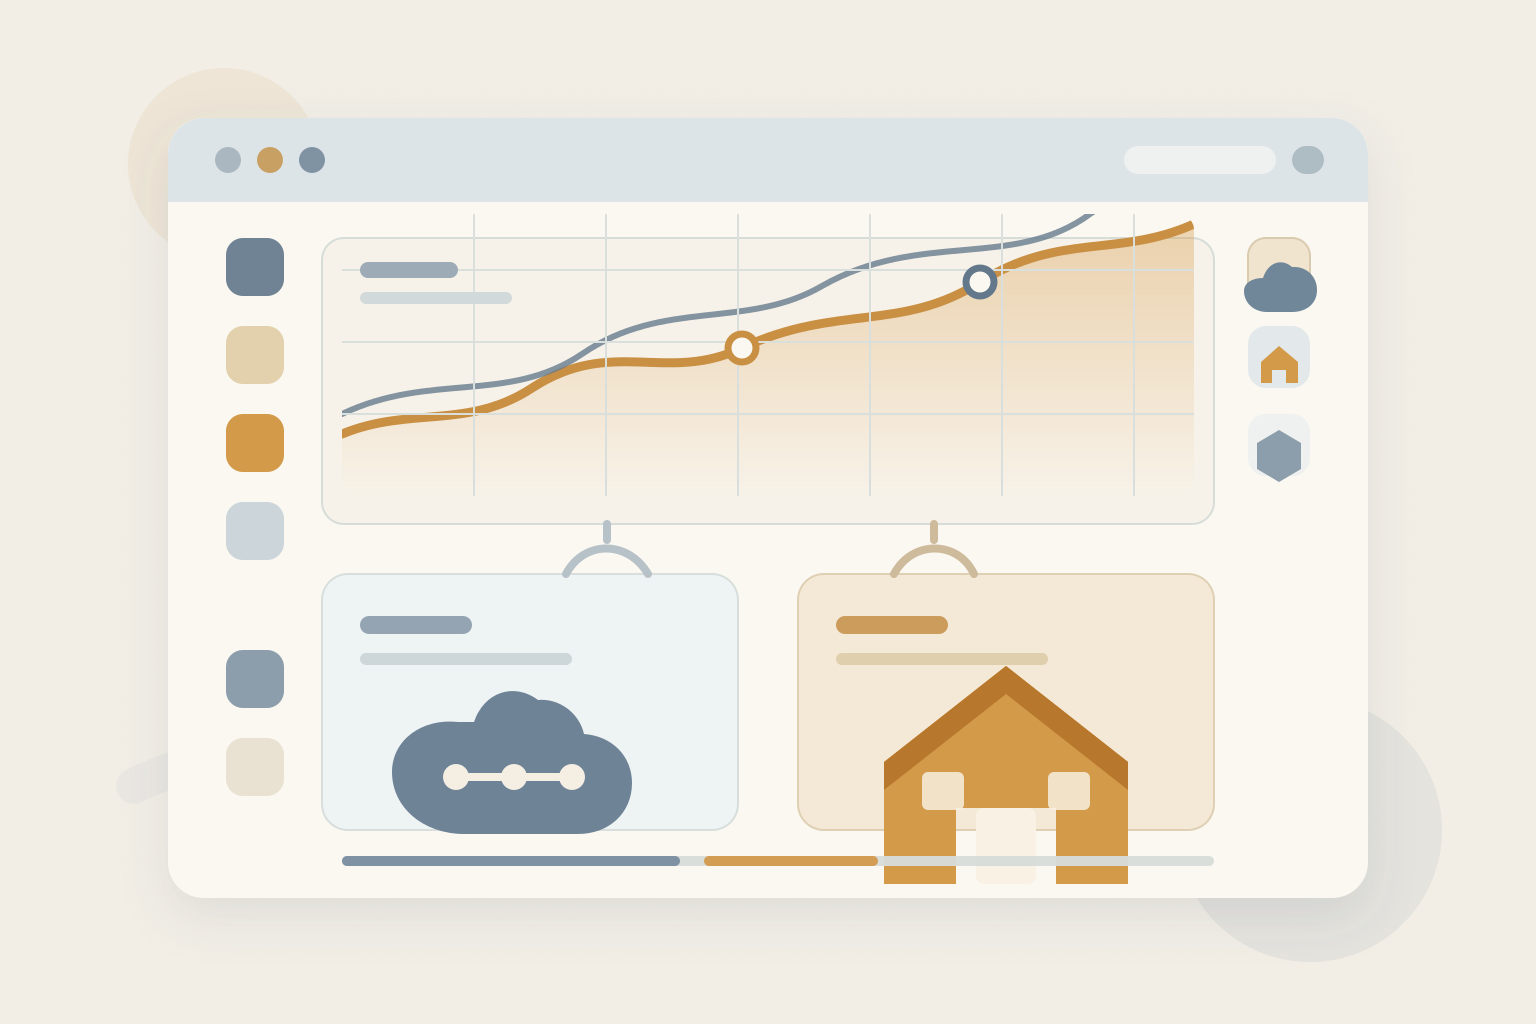
The payoff of self-hosting is one consolidated view you own — metrics, logs, and health together instead of three vendor tabs.
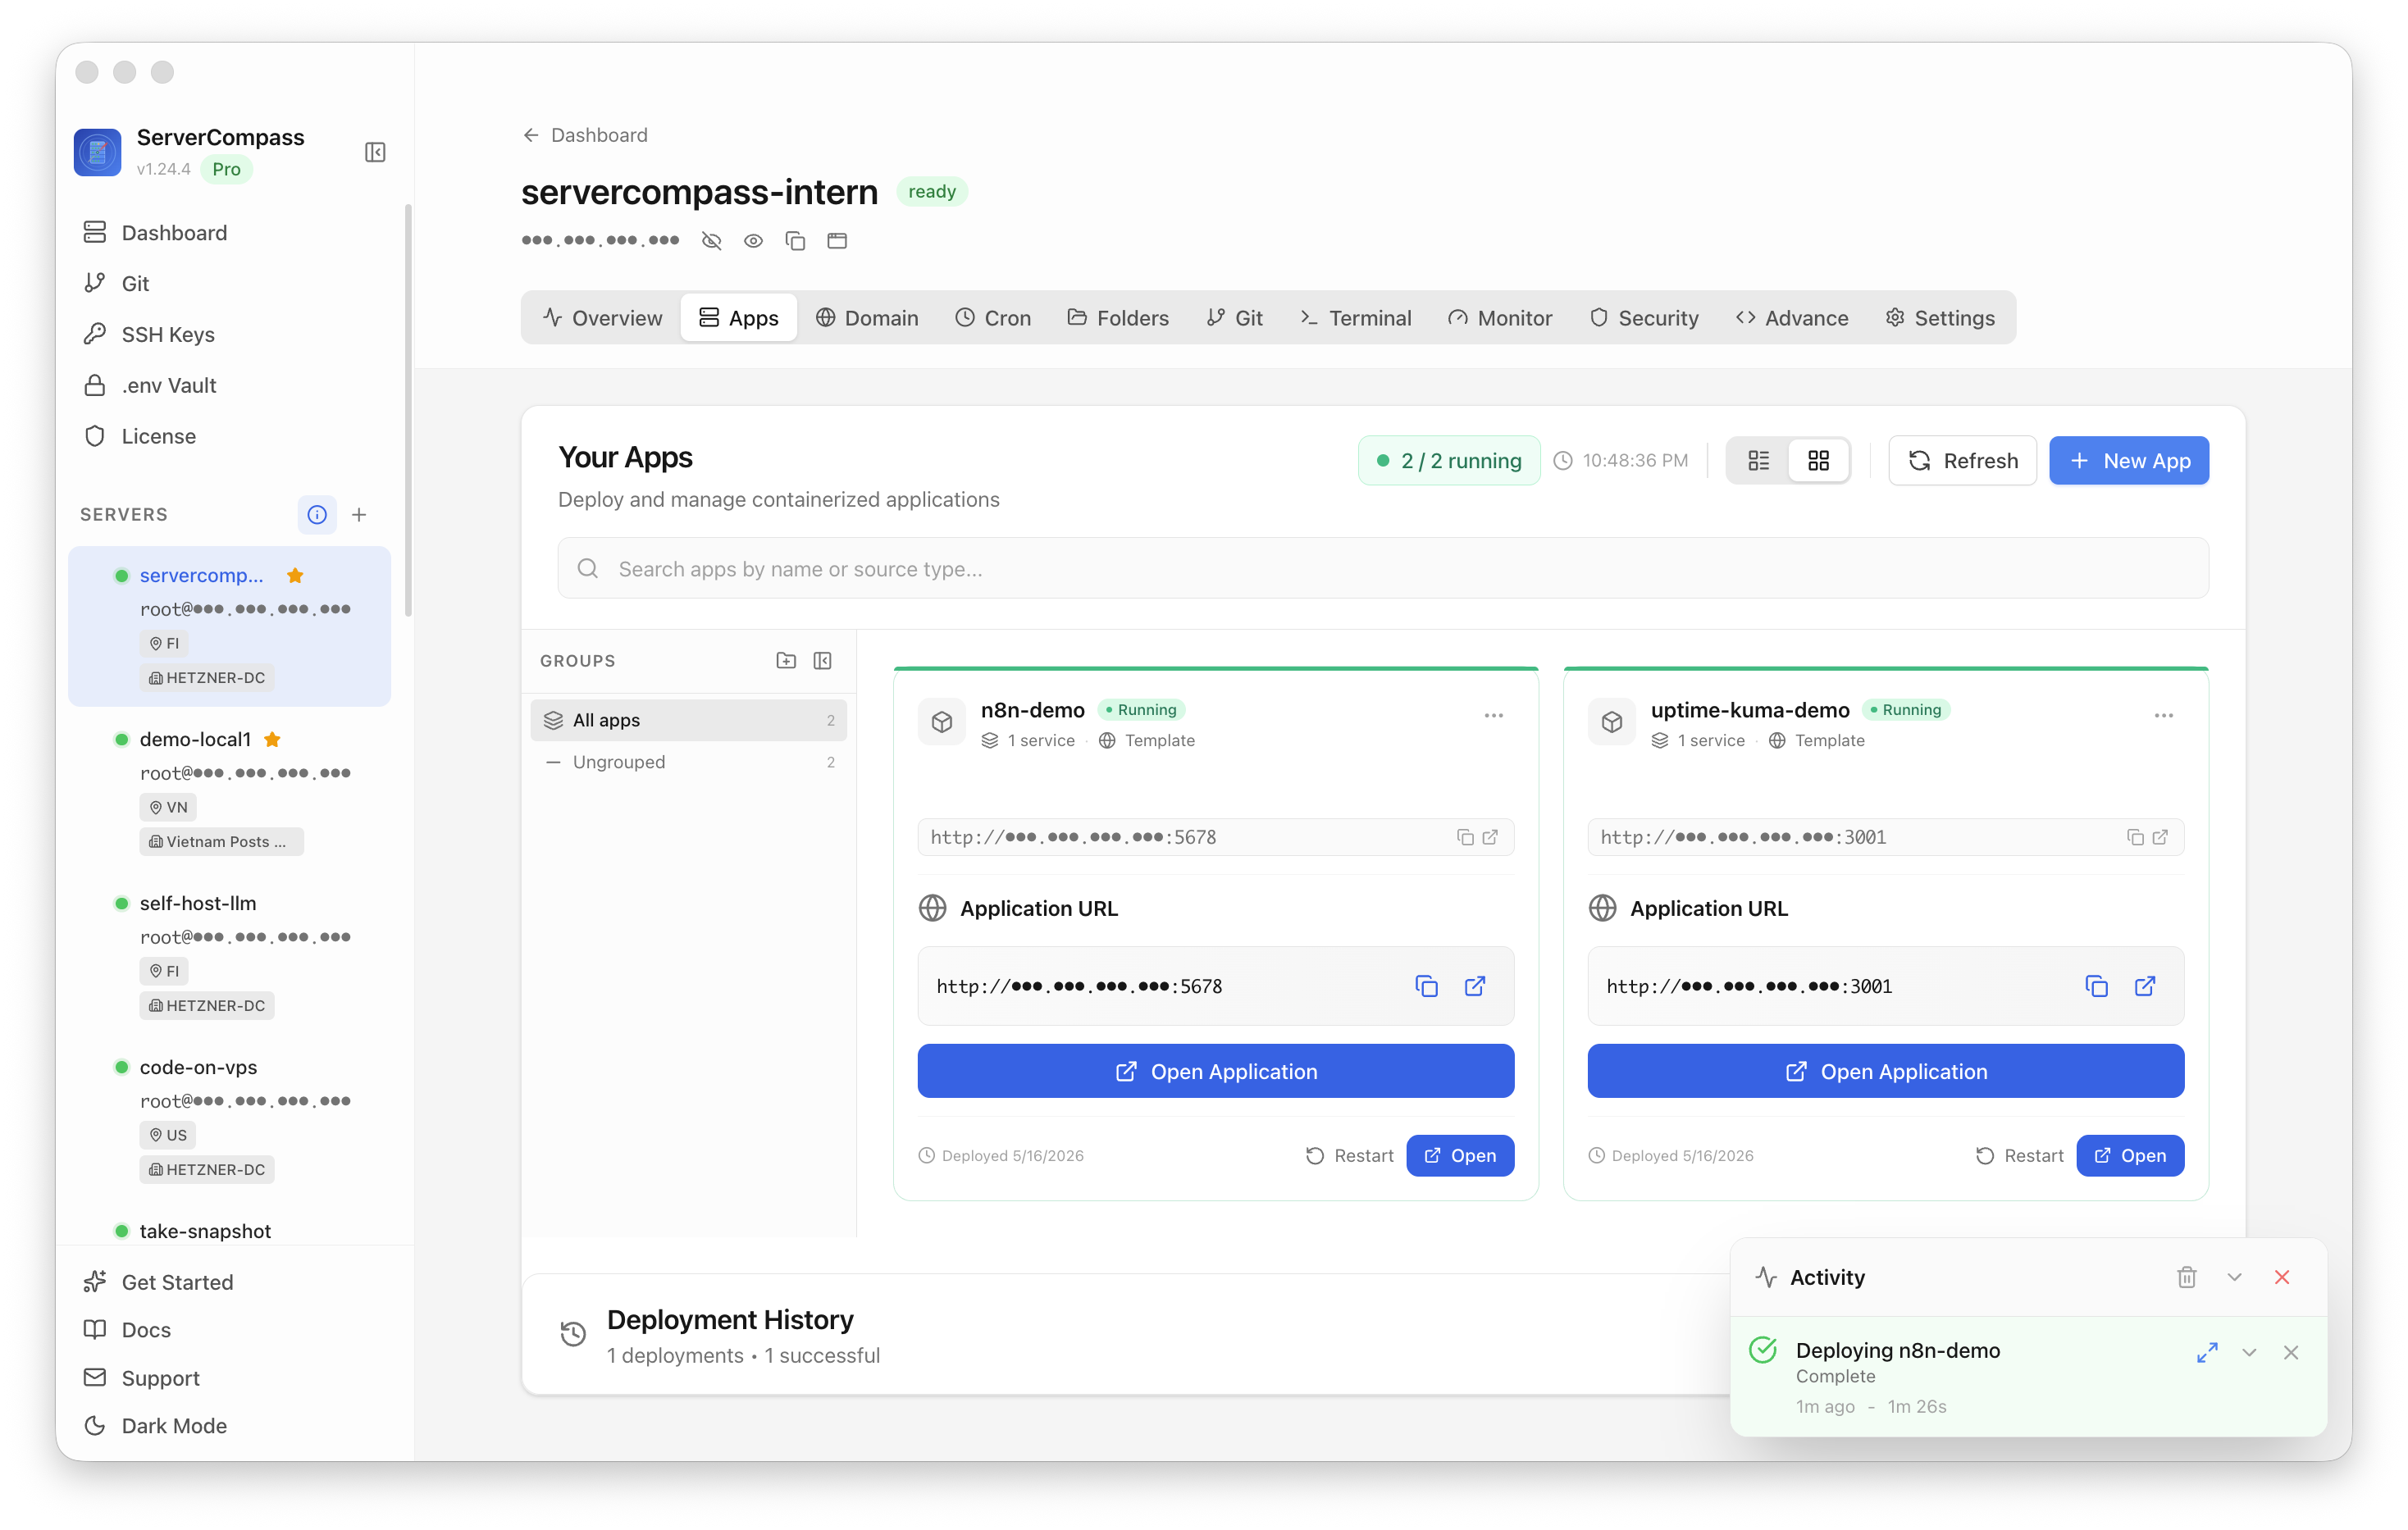
A single pane over the whole fleet in ServerCompass — the consolidated health view that makes self-hosted observability worth the migration.
Migration checklist
- Retention set per signal; old metrics downsampled, old logs aged out.
- Metric labels bounded; no unbounded IDs as labels.
- Logs sampled and level-scoped; only queryable data indexed.
- Host sized to real volume with memory limits.
- Alerting reused, not rebuilt noisy.
Takeaway
Leaving a hosted observability vendor saves money only if you carry the discipline across with the data. Bound retention, cardinality, and log volume before you migrate, size the box for the real load, and you get an observability stack you own without the surprise bill following you home.
From across the StoicSoft network
Hand-curated reads on the same topic from sister sites in the StoicSoft family.