The VPS benchmark checklist: 7 measurements that beat marketing specs
Two VPS instances with identical 8-vCPU/16-GB/1-Gbps specs routinely run 2-3x apart. Here is the 60-minute, seven-measurement checklist — single- and multi-thread CPU, steal time, 4K random IOPS, sequential throughput, egress, and p99 latency — that tells you which provider you are actually buying.
You've narrowed it to two providers at the same price point. The spec sheets are identical: 8 vCPU, 16 GB RAM, 1 Gbps NVMe, "low latency." The marketing graphs are unfalsifiable. The reviews are sponsored. You still have to pick one.
The honest answer is to rent a trial on each and benchmark for one hour. Two VPS instances with identical labels routinely perform 2-3x apart on the same workload — the labels describe the bus the engine sits on, not the engine. This post is that one hour: seven measurements, the exact commands, and the protocol that catches what marketing pages are designed to hide.
The seven measurements that matter
- Single-thread CPU steady-state — predicts request latency for any non-parallel workload (most web request handlers, JS engines, database query planners).
- Multi-thread CPU steady-state — predicts throughput for parallelisable work (compilation, batch jobs, request fan-out).
- CPU steal time under sustained load — exposes noisy neighbours. The number that separates a quiet hypervisor from an oversold one.
- 4K random IOPS at QD=1 and QD=32 — predicts database p99. The single most important disk number for OLTP.
- Sequential disk throughput — predicts backup, restore, and bulk-load times.
- Network egress to representative endpoints — predicts CDN-origin throughput and cross-region replication.
- Network latency p50/p99 to the same endpoints — predicts user-facing latency and replication lag tails.
Each of these maps to a real production failure mode. Run them in this order on both providers.
1. Single-thread CPU steady-state
Marketing pages quote "up to 4 GHz." That's a peak frequency held for milliseconds. What you need is the speed the core sustains for ten minutes — the figure that determines how fast a single HTTP request, a single SQL plan, or a single Node event-loop tick actually runs.
sudo apt-get install -y sysbench
sysbench cpu --threads=1 --time=600 --cpu-max-prime=20000 run
Record the events-per-second figure. Anything that drops more than 10% between minute one and minute ten is thermally throttled or burst-credited. Run the test twice in a row without sleeping between runs — if the second run is meaningfully slower than the first, the provider is rationing CPU and your production traffic will hit the same wall.
2. Multi-thread CPU steady-state
sysbench cpu --threads=$(nproc) --time=600 --cpu-max-prime=20000 run
Divide the total events-per-second by the single-thread number. A healthy VM scales to roughly 0.85x the core count. A VM that scales to 0.4x is sharing physical cores with neighbours via SMT, even though the dashboard shows you "8 vCPU."
3. CPU steal time under sustained load
While the multi-thread test is running, in another shell:
mpstat 1 60 | awk '/Average/ {print "steal=" $NF}'
Steal above 2% means the hypervisor is preempting your VM to serve other tenants. Above 5% sustained is disqualifying for any latency-sensitive workload. Marketing pages never mention steal because they can't promise a number that depends on the neighbours you can't see.
4. Disk: 4K random IOPS at QD=1 and QD=32
This is where "100k IOPS" claims fall apart. That number is almost always measured at QD=64+ with sequential 4K writes — a workload no real database produces.
sudo apt-get install -y fio
# QD=1 — measures latency floor (the number a single transaction sees)
fio --name=randread-qd1 --filename=/tmp/fio.test --rw=randread --bs=4k \
    --size=2G --runtime=120 --time_based --iodepth=1 --direct=1 --group_reporting
# QD=32 — measures throughput ceiling under realistic concurrency
fio --name=randread-qd32 --filename=/tmp/fio.test --rw=randread --bs=4k \
    --size=2G --runtime=120 --time_based --iodepth=32 --direct=1 --group_reporting
# Repeat both with --rw=randwrite
--direct=1 skips the page cache so you measure the actual block device. --time_based --runtime=120 outlasts the typical burst-credit window. Capture both IOPS and the p99 latency line — p99 is what your slowest user feels.
5. Disk: sequential read and write
fio --name=seq --filename=/tmp/fio.test --rw=read --bs=1M \
    --size=4G --runtime=60 --time_based --iodepth=8 --direct=1 --group_reporting
fio --name=seq-w --filename=/tmp/fio.test --rw=write --bs=1M \
    --size=4G --runtime=60 --time_based --iodepth=8 --direct=1 --group_reporting
Compare sustained MB/s, not the burst peak. Many providers cap sustained throughput at 30-50% of the advertised peak.
6. Network egress to three representative endpoints
You need at least three targets to triangulate: the provider's own load balancer (best case, intra-network), a Cloudflare or Fastly POP near you (typical CDN-origin path), and a public iperf3 server in a different continent (worst-case egress).
sudo apt-get install -y iperf3 mtr
# Replace targets with your real workload's geography
iperf3 -c iperf.he.net -t 60 -P 4
iperf3 -c speedtest.serverius.net -t 60 -P 4
iperf3 -c <your-cdn-or-app-region> -t 60 -P 4
-P 4 runs four parallel streams — single-stream throughput is bottlenecked by TCP window size and undersells modern links. "1 Gbps port" usually means the NIC is capable of 1 Gbps; the provider's egress shaper may cap you at 200-400 Mbps sustained.
7. Network latency p50/p99 to the same endpoints
mtr -rwzbc 600 iperf.he.net
mtr -rwzbc 600 speedtest.serverius.net
mtr -rwzbc 600 <your-cdn-or-app-region>
600 packets over 10 minutes catches the tail. Look at the last hop's worst column — that's your p99 plus jitter. A p50 of 12 ms with a p99 of 280 ms means your users see a smooth median and a broken long tail.
What burst credits hide
Most cloud providers grant a window of unthrottled CPU and disk before stepping you down to a sustained baseline. AWS T-series, Vultr Cloud Compute, DigitalOcean Premium — all of them. The window is usually 2-5 minutes for CPU and 30-60 seconds for disk.
A 30-second sysbench cpu run finishes inside the burst window. Both providers will look identical. A 10-minute run separates the steady-state ceiling from the marketing peak. This is why --time=600 on sysbench and --time_based --runtime=120 on fio are non-negotiable parameters. Anything shorter measures the brochure, not the hardware.
The same logic applies to disk. A common trick is to run dd if=/dev/zero of=test bs=1M count=1024 and report 2 GB/s. That's the page cache, not the disk; the file never hit storage. Another is to run a 10-second fio job that fits inside the SSD controller's write buffer. Both numbers are real and both numbers are useless. The fix is --direct=1 (skip the page cache), --time_based --runtime=120 (outlast the buffer), and a working set larger than RAM (--size=2G on a 1 GB VM, scaled up otherwise). Production workloads don't fit in cache; benchmarks shouldn't either.
The radar-chart rule
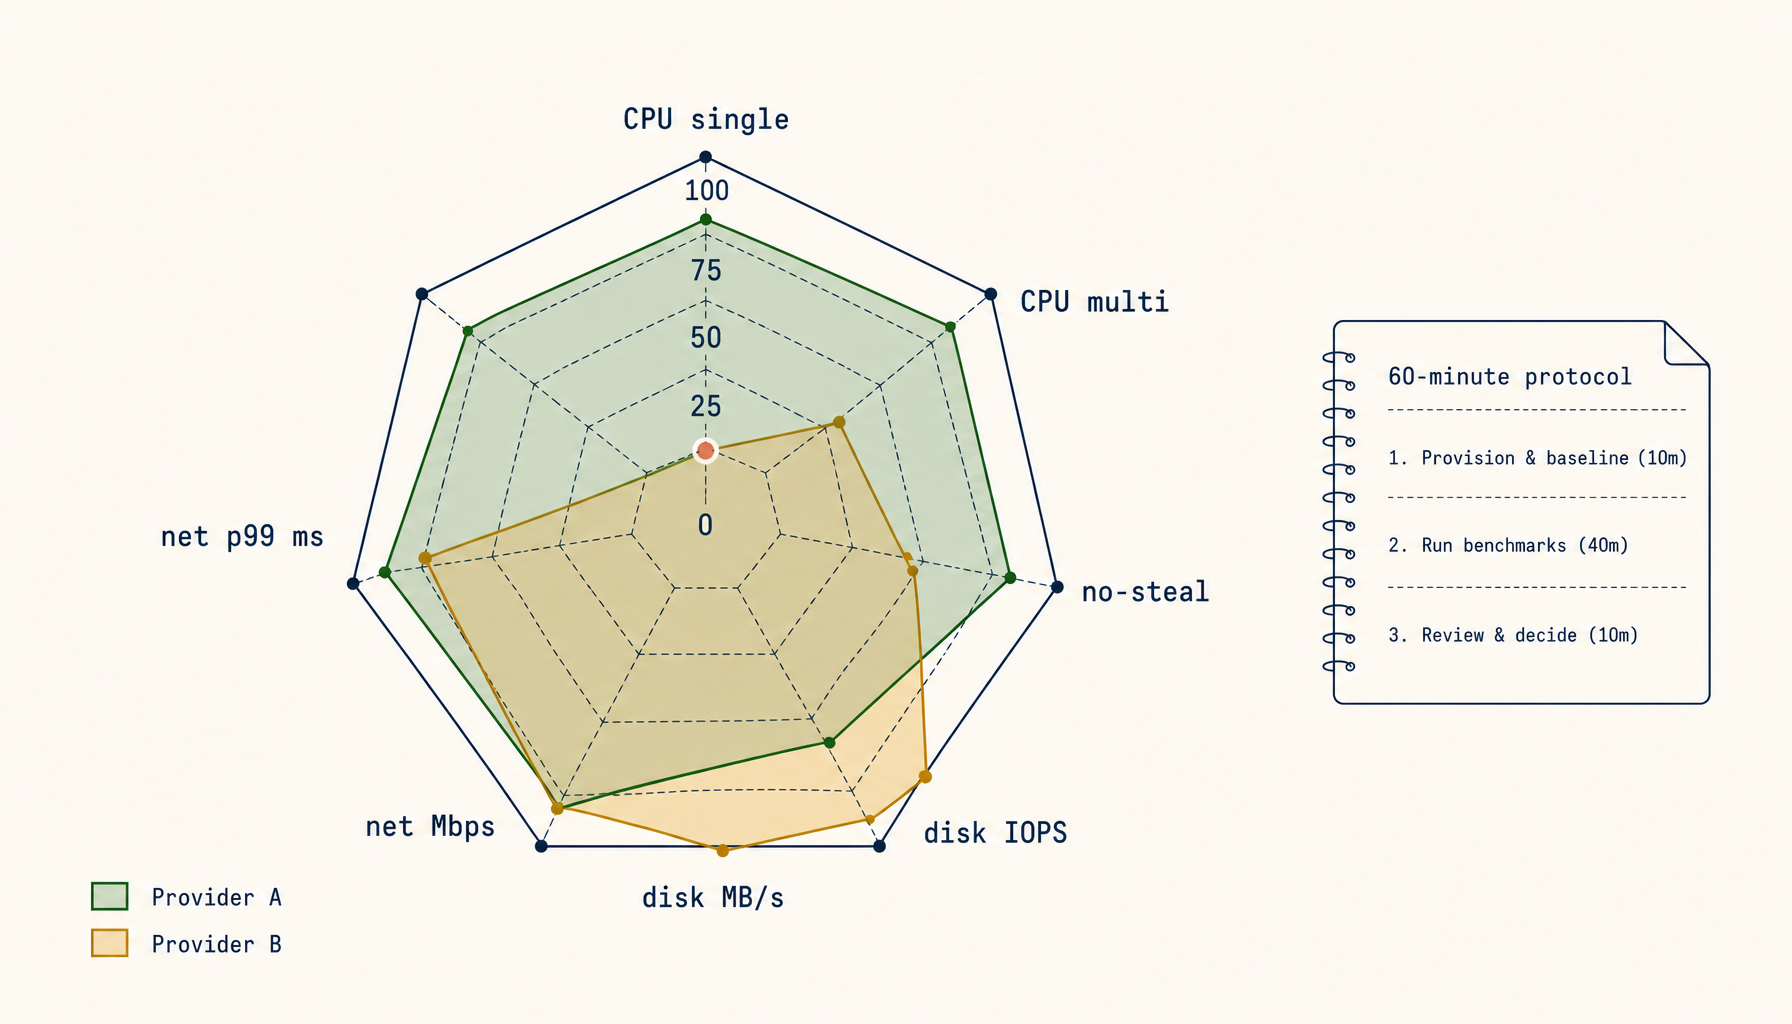
No single number captures VPS quality; a 7-axis radar chart does. Plot all seven measurements on a 0-100 scale, normalised to whichever provider scored higher on each axis, and pick by shape, not area.
A provider that wins on CPU but collapses on disk-p99 is wrong for a database. A provider that wins on egress throughput but loses on single-thread CPU is wrong for a CPU-bound app server. A provider with a triangle that points entirely at network is right for a CDN edge node and wrong for almost everything else. The shape tells you what the VM is actually for.
The shape also tells you when neither provider fits. If both polygons collapse on the same axis — say, both providers show 4K random write IOPS under 2,000 — the right answer isn't to pick the less-bad one, it's to look at a different tier of product. A radar chart with a deep notch on the axis your workload depends on is a buy-signal for a different provider class entirely (managed database, dedicated NVMe instance, bare metal), not for either of the two VMs you tested.
The 60-minute protocol
- Provision both VMs at the same hour. Region-load varies by time of day; running provider A on Monday morning and provider B on Saturday night compares the schedule, not the hardware.
- Run the seven measurements in the same order on both. Order matters because earlier tests warm caches and consume burst credits.
- Capture every number to a markdown file. Raw
sysbenchandfiooutput, not summaries. You will want to re-read the latency histograms later. - Repeat the disk and network tests three times, spaced 15 minutes apart. Bursts and noisy-neighbour windows come and go on minute-scale. One sample per metric is a guess; three samples is a measurement.
- Tear down at the end of the trial. Don't keep paying for the loser out of inertia.
The total clock time is about 60 minutes if you run the long tests in parallel across two SSH sessions.
Common provider-marketing footnotes that lie
- "Up to 4 GHz" — peak boost frequency for milliseconds, not the speed your workload runs at.
- "100k IOPS" — measured at a specific block size and queue depth chosen to make the number look big. Always smaller at 4K QD=1.
- "1 Gbps" — port speed, not sustained throughput. The shaper is somewhere lower.
- "Low latency" — meaningless without a target endpoint. Latency is a graph, not a number.
- "NVMe SSD" — describes the protocol and media, not whether you're getting dedicated capacity or a thin slice of a shared pool.
- "Unmetered bandwidth" — almost always means unmetered up to a fair-use threshold that's published nowhere.
When you see one of these on a comparison page, mentally replace it with "we measured this once under ideal conditions."
Close
Marketing specs describe the bus the engine sits on. Benchmarks describe the engine. Rent the trial, run the seven measurements, save the markdown — you'll have a buyer's report no marketing team can argue with, and the cost is one hour and the price of two trial VMs.
The provider that wins your radar-chart shape is the one whose pager you should be willing to inherit.
Related in the StoicSoft network
If you run monitoring, uptime checks, or alerting across self-hosted apps like the ones above, ServerCompass is the StoicSoft network's tool for wiring tiered severity, flap suppression, and low-noise alerts into a single dashboard.