Coolify logs after Vercel — closing the route-level observability gap without OTel
Developers leaving Vercel for Coolify hit the same wall: where are the searchable route-level logs? Here's the smallest setup that gets you there without a full OpenTelemetry stack.
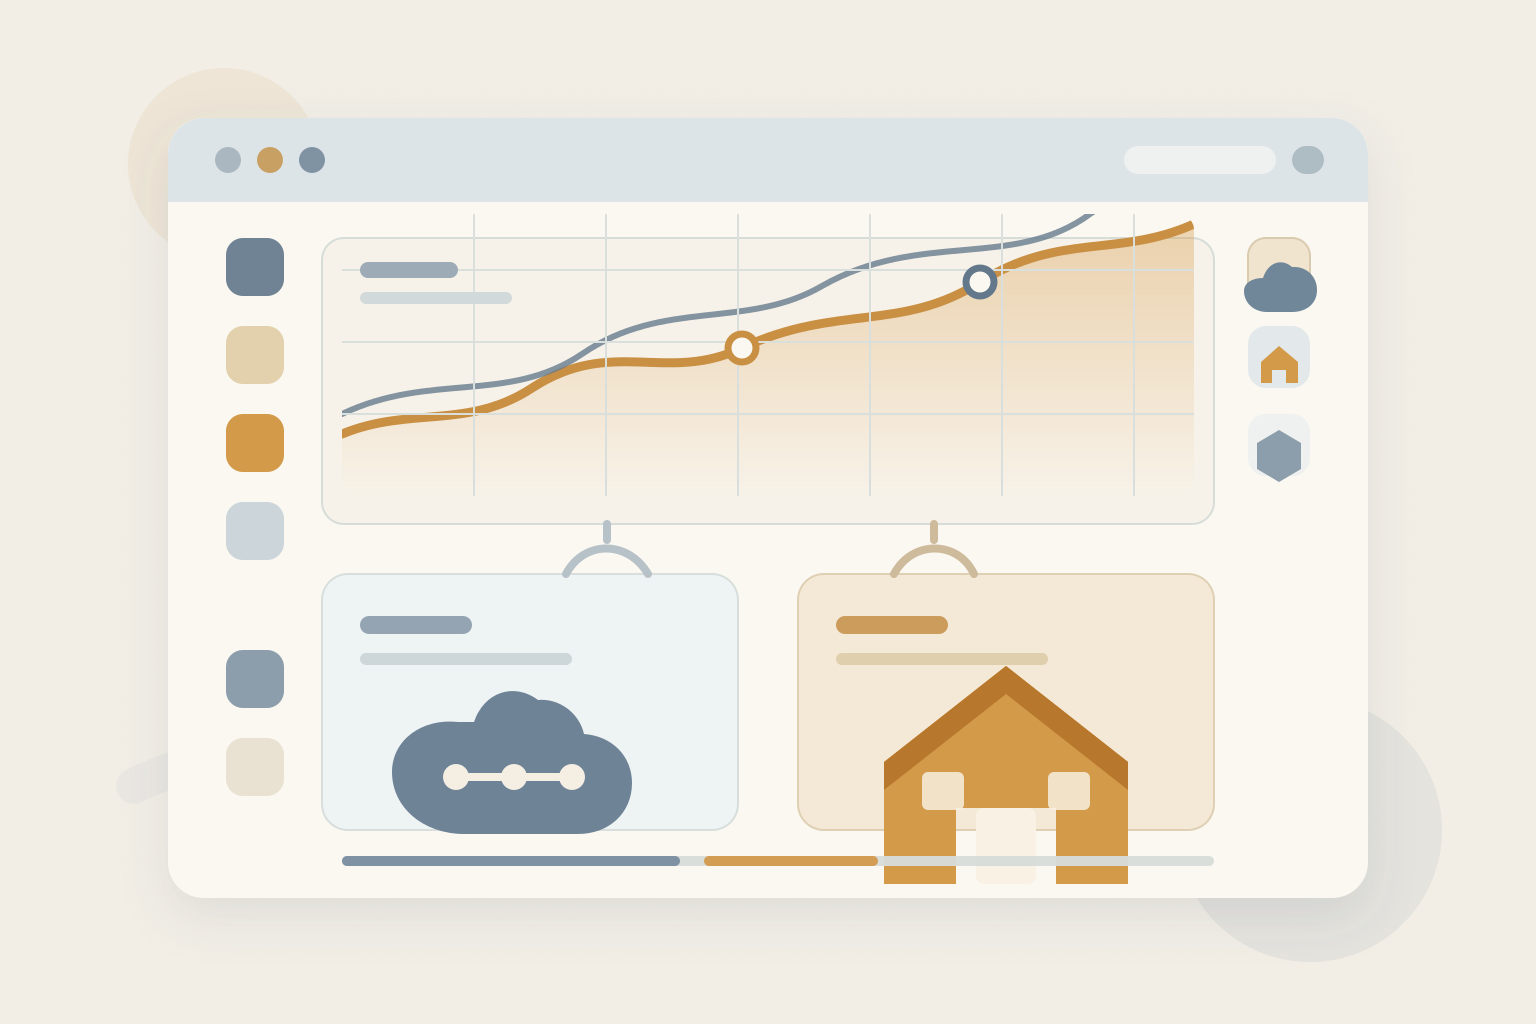
Vercel's dashboard spoiled a lot of developers. You ship a Next.js app, you click into the Functions tab, and there's the per-route latency, the recent errors, the request traces. The signal is there before you ask.
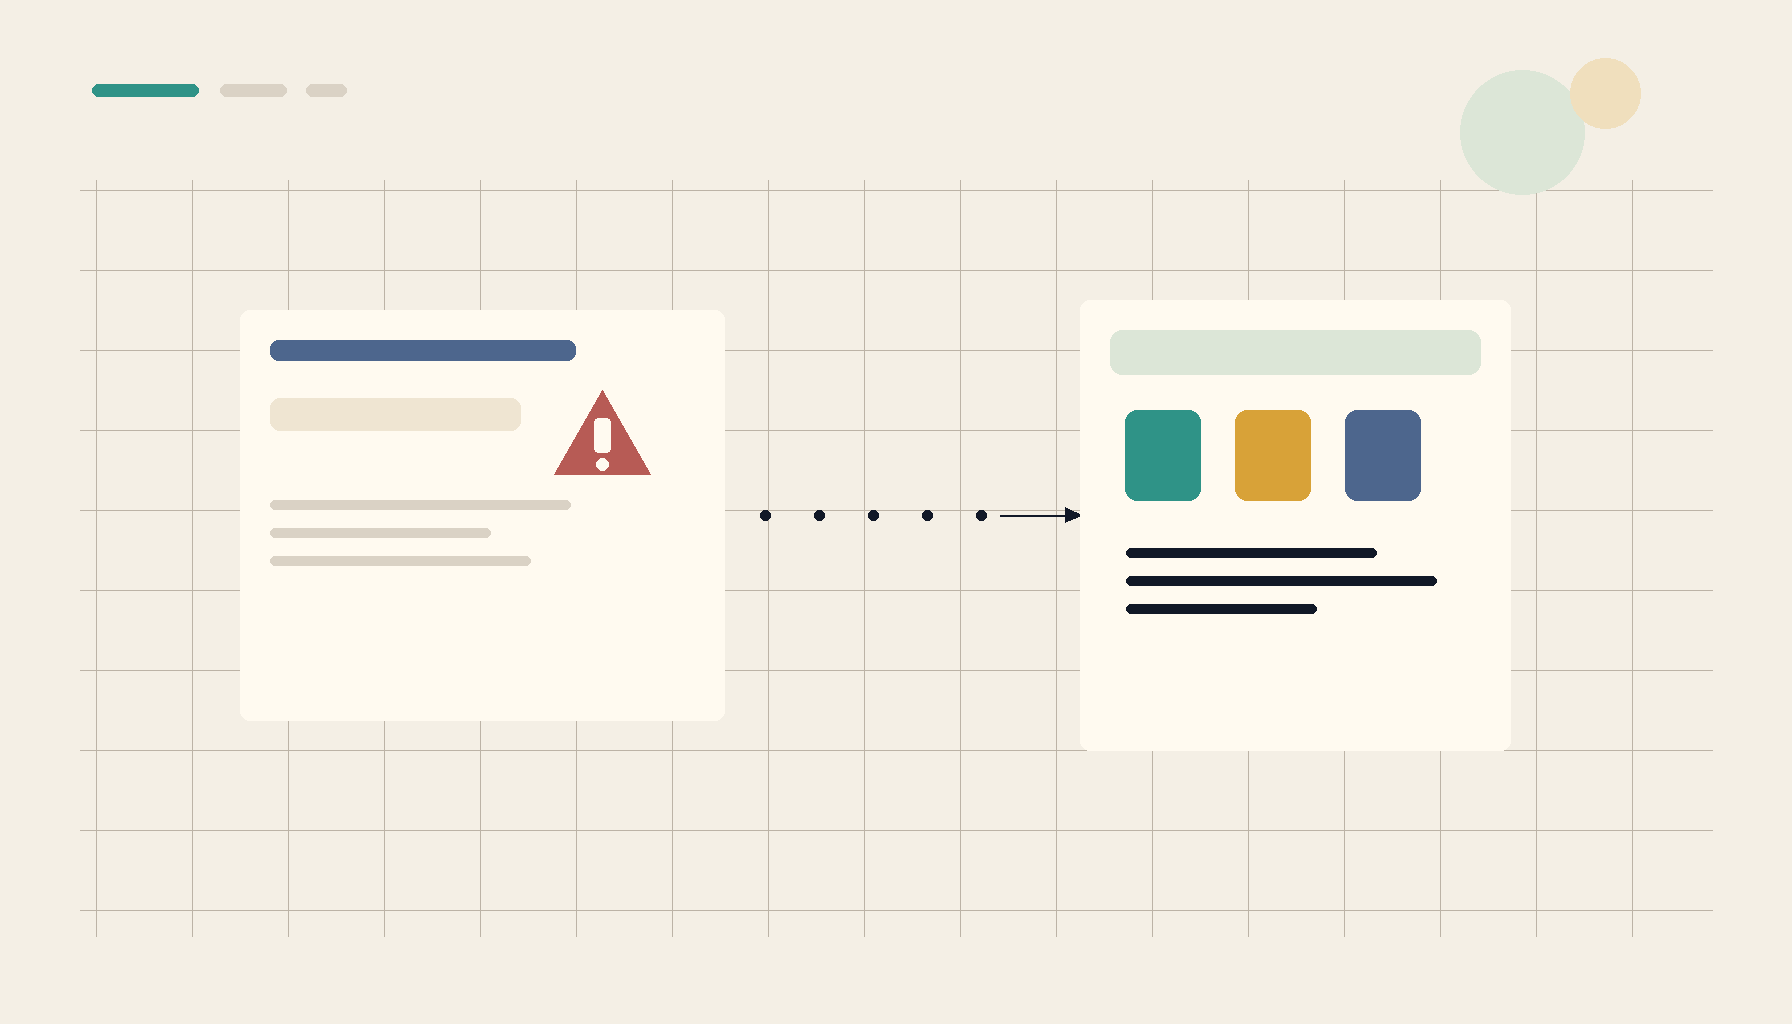
Now you've moved off Vercel because the pricing math didn't work — congrats, that's healthy — and you've landed on Coolify. Deploy is fast. The dashboard is clean. Then you go to investigate a slow request and the observability gap hits. There's no per-route view. There's no searchable log surface. There's a Docker logs panel that's fine for last-five-minutes debugging and useless for "what happened at 3pm yesterday on /api/checkout?"
The internet's answer is "set up SigNoz with OpenTelemetry." That's not wrong, but it's a weekend of work and a lot of moving pieces. There's a lighter path that recovers most of the Vercel-style insight in an afternoon.
This guide is the lighter path.
What you actually had on Vercel
Before reaching for tools, it helps to name what Vercel was giving you. The bits that mattered:
- Per-route latency aggregates (p50/p95) over a recent window.
- Per-route error counts and the recent error responses.
- A searchable log feed that filtered by route and time range.
- Cold-start info (less relevant on Coolify since you're not on serverless).
- A request-ID convention that tied logs to specific requests.
Notice how much of this is structured logging plus some aggregation. There's not a lot of magic. The hard part on Vercel was the magic of "it just shows up"; the hard part on Coolify is having to wire the structured logging and aggregation yourself.
The minimum useful setup
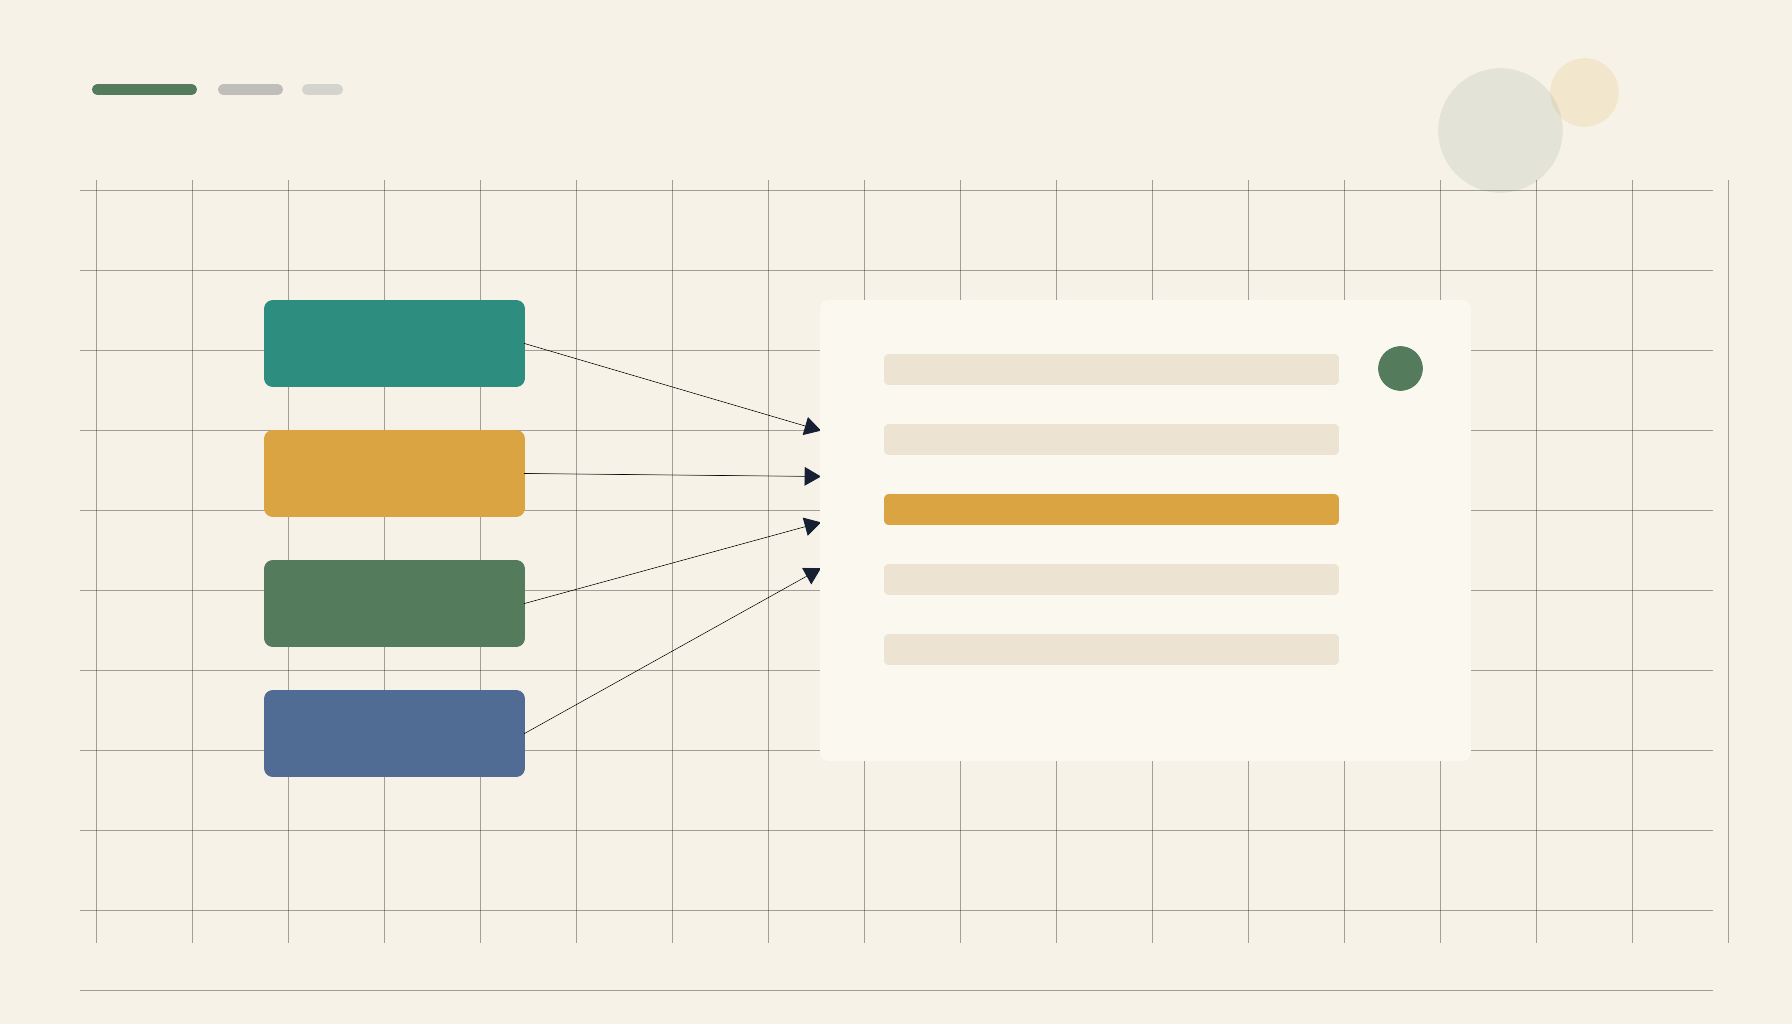
The smallest setup that closes the gap has three pieces:
- Structured logs from the app. Every request emits a JSON log line with timestamp, request ID, route, status, latency, and user-agent (plus whatever else you want).
- A log collector that can search. Loki is the easy default for self-hosted; tail-based with grafana for the UI. Alternatives: Logtail, Better Stack, or just a SQLite-backed collector.
- A small rollup script. Every minute, the script reads recent logs and writes per-route aggregates (count, errors, p50, p95) into a small store. This powers the dashboard.
None of these require an OpenTelemetry collector. None of them require a separate metrics store. The structured log is the source of truth; everything else is derived from it.
Step 1: structured logs in the app
Whatever framework you use, drop a middleware that emits JSON log lines per request.
For Next.js (App Router), in a route handler or a middleware:
import { NextResponse } from "next/server";

export function middleware(req: Request) {
  const start = Date.now();
  const requestId = req.headers.get("x-request-id") || crypto.randomUUID();
  const res = NextResponse.next();
  res.headers.set("x-request-id", requestId);
  res.headers.set("server-timing", `total;dur=${Date.now() - start}`);

  // Emit a JSON log line
  console.log(JSON.stringify({
    t: new Date().toISOString(),
    rid: requestId,
    method: req.method,
    path: new URL(req.url).pathname,
    status: res.status,
    ms: Date.now() - start,
  }));

  return res;
}
For Express:
app.use((req, res, next) => {
  const start = Date.now();
  const rid = req.headers["x-request-id"] || crypto.randomUUID();
  res.on("finish", () => {
    console.log(JSON.stringify({
      t: new Date().toISOString(),
      rid,
      method: req.method,
      path: req.path,
      status: res.statusCode,
      ms: Date.now() - start,
    }));
  });
  next();
});
Different frameworks vary in the details. The shape is the same: one JSON line per request, with route, status, latency, request ID.
Step 2: ship the logs into a searchable store
Coolify deploys containers; Docker captures their stdout. The simplest path:
- Install Loki + Promtail on your Coolify host (one Docker Compose file).
- Promtail tails Docker logs and ships them to Loki.
- Grafana (also a container) reads Loki and gives you the search UI.
A minimal compose snippet:
services:
  loki:
    image: grafana/loki:latest
    ports: ["3100:3100"]
    volumes: ["./loki:/loki"]

  promtail:
    image: grafana/promtail:latest
    volumes:
      - /var/lib/docker/containers:/var/lib/docker/containers:ro
      - /var/run/docker.sock:/var/run/docker.sock
      - ./promtail.yaml:/etc/promtail/config.yml

  grafana:
    image: grafana/grafana:latest
    ports: ["3000:3000"]
    volumes: ["./grafana:/var/lib/grafana"]
With Grafana pointed at Loki, you now have a search UI: "show me lines where path=/api/checkout and status>=500 in the last 24h" returns results in seconds.
This already recovers most of Vercel's log search feature.
Step 3: a tiny per-route rollup
For the latency aggregates Vercel showed, write a small script that runs every minute (via cron or a sidecar). The script queries Loki for the last minute's logs, parses them, and writes aggregates to SQLite or DuckDB:
# rollup.py
import json, sqlite3, time, requests

NOW = int(time.time() * 1000)
WINDOW = 60 * 1000

rows = requests.get(
  "http://loki:3100/loki/api/v1/query_range",
  params={
    "query": '{job="docker"}',
    "start": (NOW - WINDOW) * 1e6,
    "end": NOW * 1e6,
    "limit": 5000,
  }).json()

buckets = {}
for stream in rows["data"]["result"]:
  for ts, line in stream["values"]:
    try:
      d = json.loads(line)
      key = (d["path"], d["status"])
      b = buckets.setdefault(key, [])
      b.append(d["ms"])
    except Exception:
      pass

conn = sqlite3.connect("/data/rollup.db")
for (path, status), durations in buckets.items():
  durations.sort()
  p50 = durations[len(durations)//2]
  p95 = durations[int(len(durations)*0.95)]
  conn.execute(
    "INSERT INTO rollup(ts,path,status,count,p50,p95) VALUES (?,?,?,?,?,?)",
    (NOW, path, status, len(durations), p50, p95))
conn.commit()
A single Grafana panel (or a Flask page) that reads this table gives you per-route latency over time. That's Vercel's function dashboard, minus the polish.
Adding event overlays
Vercel showed you the deploy line on top of the latency graph. You can replicate that:
- On every successful deploy, emit a one-line event (JSON, structured).
- Promtail picks it up.
- The Grafana panel uses Loki's annotation feature to draw a vertical line at the deploy timestamp.
Now when latency spikes after a deploy, you can see it in one glance.
The same applies to cron jobs, restarts, or any operational event you want overlaid. The pattern is consistent: emit a structured log, surface it as an annotation.
What this doesn't give you (and what to do about it)
The lighter path doesn't cover everything Vercel did. Honest list:
Distributed traces. If you have multiple services and want to follow a request end-to-end, the lighter path won't trace across services. Solution: pass the request ID through every internal call, and use Loki's search to manually correlate. For full tracing, you'll eventually want OpenTelemetry.
Real-user monitoring (RUM). Vercel had Web Vitals built in. Lighter path doesn't. Add a small RUM script that posts metrics to a /rum endpoint, log them structured.
Sampling. At very high volume, structured logs get expensive. Loki helps; eventually you'll want sampling. Not a day-one concern.
Auto-correlation. Vercel grouped "all logs for this request" automatically. With the request ID convention you've added, you do the grouping by searching rid=<uuid>.
For most Vercel migrants on Coolify, the lighter path covers 80% of the use. The remaining 20% is OpenTelemetry territory; defer it.
Operational notes
A few real things to mind:
- Disk usage. Loki at default settings can grow fast. Set retention to 14 or 30 days. Mount its data directory on a volume that's big enough.
- Loki + Coolify network. Make sure your app containers and Loki containers are on the same Docker network, or expose Loki and have Promtail ship over TCP.
- Don't log secrets. Structured logs are searchable; passwords and tokens should not be in them.
- Backups. The rollup SQLite/DuckDB file is small; back it up. Loki's chunks are large; up to you.
The order I'd recommend
If you're a Vercel migrant on Coolify today, the smallest path forward:
- Add structured logging middleware to your app. Deploy.
- Verify Docker logs show the JSON format on your Coolify host.
- Stand up Loki + Promtail + Grafana via Docker Compose.
- In Grafana, configure Loki as a data source. Run a query for the last hour.
- Build one panel: requests per route per hour.
- Add one more panel: p95 latency by route.
- Add event annotations for deploys.
- Stop. Use what you have for a few weeks. Add more only when a specific need shows up.
This trajectory gets you to a useful observability surface in an afternoon. From there, you can grow into OpenTelemetry when the system genuinely needs distributed tracing.
The summary
The Coolify observability gap is real for Vercel migrants. The fix isn't a full OTel stack on day one. It's structured logging in the app, Loki + Grafana for search, a small rollup script for per-route aggregates, and event overlays for deploys. That setup recovers most of the Vercel insight, costs an afternoon to build, and grows naturally into a heavier stack only if the system grows past it.
From across the StoicSoft network
Hand-curated reads on the same topic from sister sites in the StoicSoft family.