Best single-dashboard app health for self-hosters who aren't ready for Prometheus
Homelab and VPS users want one calm dashboard for app health — not a full observability stack. Here are the tools that hit the middle layer between SSH and Grafana.
There's a gap in the self-hosting tool landscape that catches a lot of people in the middle.
On one side: shared hosting and managed services, where someone else worries about whether your stuff is up.
On the other side: a full Prometheus + Grafana + Alertmanager stack, where you worry about everything, including the monitoring stack itself.
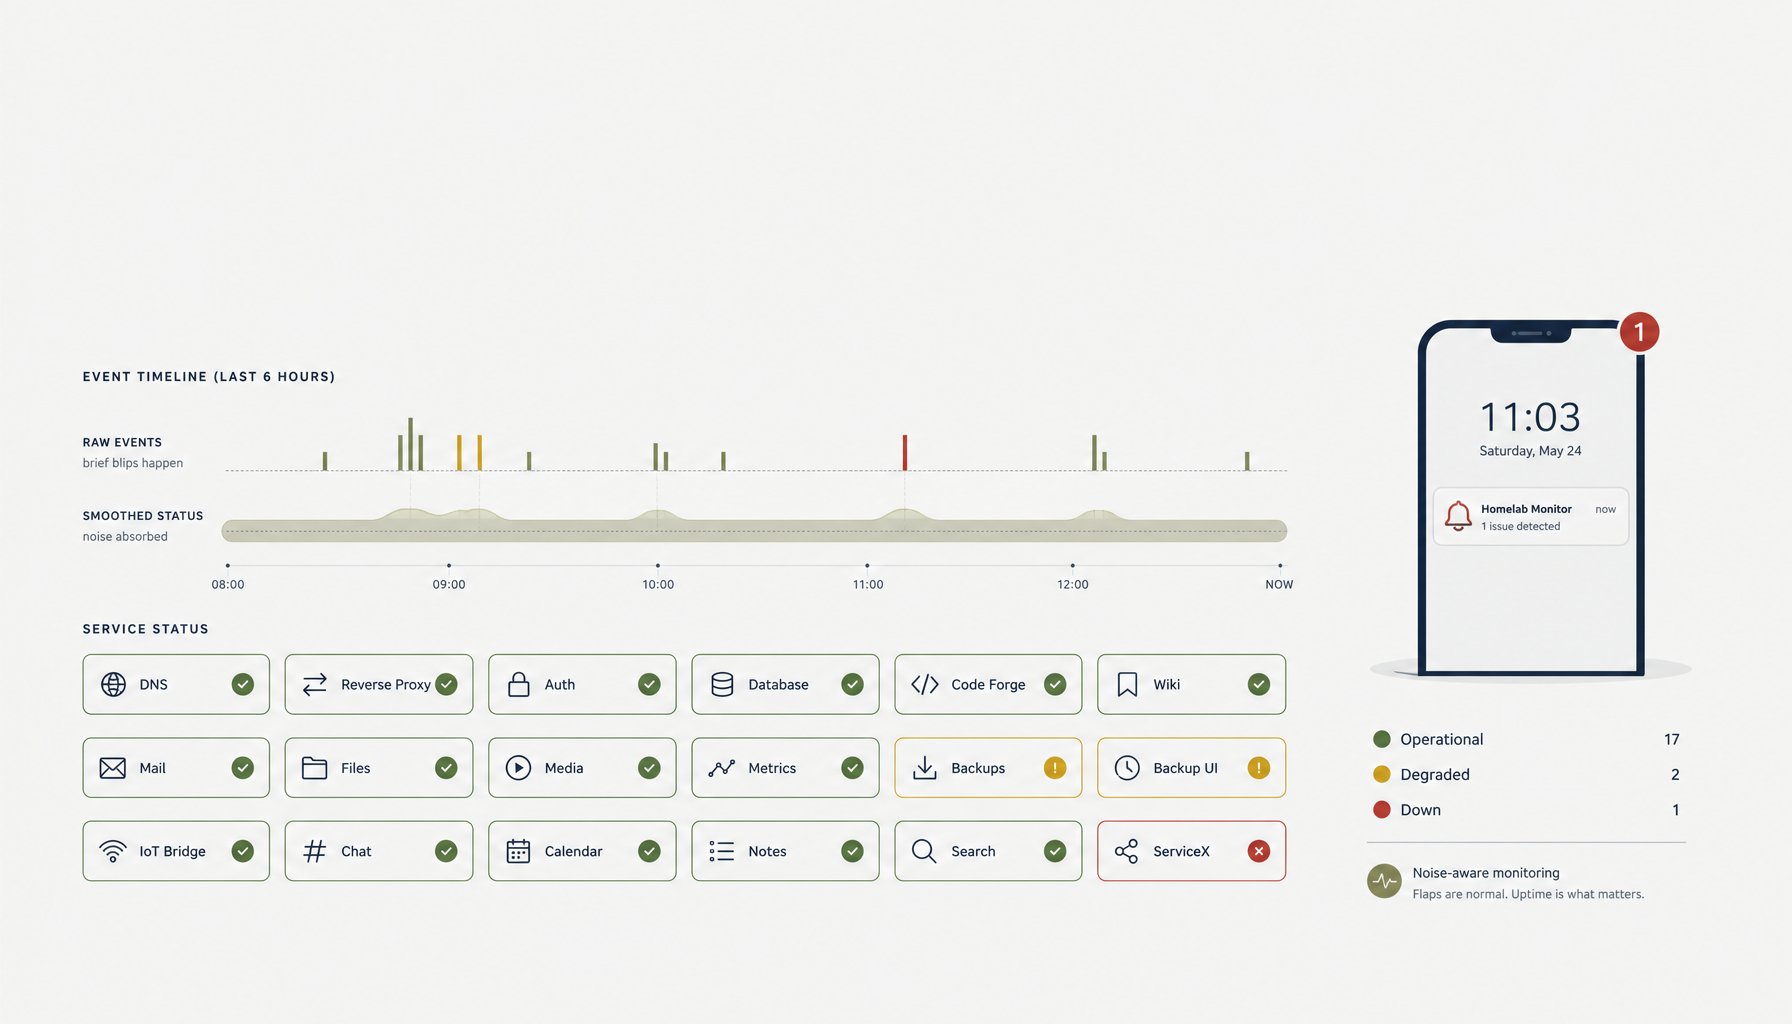
In between is the operator with three to ten apps on one or two VPSes. They want to glance at one page and know whether their things are okay. They do not want to spend a weekend wiring up exporters and dashboards. They want the calm middle.
This is a tool comparison for that middle. The shortlist is small because most tools are either too thin or too heavy. The ones that fit the gap do one job well: tell you whether your apps are healthy, in one place, without becoming a project of their own.
What "calm middle" actually looks like
Before the tools, the criteria. A calm-middle dashboard should:
- Show every app on one page, with a clear up/down state.
- Use simple checks (HTTP, ping, TCP) rather than complex metrics pipelines.
- Alert via channels the operator already uses (email, ntfy, Slack, Discord, Telegram).
- Run as one container or one binary, not a stack.
- Be debuggable in a single afternoon if something breaks.
- Survive its own restart without losing history.
If a tool ticks those six, it qualifies. Most don't.
The shortlist
Five tools cover the calm-middle category well. Different shapes, similar payoff.
Uptime Kuma
The default recommendation in this category. Self-hosted, single container, web UI for monitors and notifications. Supports HTTP, ping, TCP, DNS, push (heartbeat-style), and a couple of dozen integrations for alert channels.
Strengths:
- Setup is one Docker container.
- The status page builder is built in — share a public page if you want.
- Alert channels cover essentially every notification surface.
- Maintenance windows let you suppress alerts during planned work.
- Active development; community is large.
Weaknesses:
- The UI shows individual monitors well but doesn't group them logically for very large fleets.
- Long-term metric history is shallow; you get the latest state and a small window of past status.
- Some alert channels need version-specific config tweaks.
When it's the right pick: you have under 50 monitors, want a public status page, and want one tool to do it all.
Beszel
Newer entrant, also self-hosted. Designed around an agent-on-each-host model: each VPS runs a small Beszel agent, the hub UI shows a consolidated view. Adds light resource metrics (CPU, mem, disk, network) per host on top of the uptime checks.
Strengths:
- Per-host resource view is genuinely useful — answers "is my VPS healthy?" not just "is my app reachable?"
- Docker-aware: shows running containers per host.
- Lightweight; agents are small.
- Modern UI.
Weaknesses:
- Newer; community and integration surface are smaller than Kuma's.
- Agent installation on every host is a step Kuma doesn't require.
- Alerting integrations are fewer.
When it's the right pick: you have several VPSes and want the agent-style resource visibility alongside uptime checks.
Glances + a small dashboard
Glances is a Python tool that shows everything about a host in a TUI. With its API, you can wire multiple Glances instances into a small dashboard.
Strengths:
- Zero-friction install (pip or Docker).
- Very detailed per-host info.
- Composable; you can build the exact dashboard you want.
Weaknesses:
- The "one page for all my apps" experience is something you build yourself.
- Alerting is bring-your-own.
- Not really a turnkey product.
When it's the right pick: you want per-host detail and you're willing to assemble the dashboard.
Cockpit (with the right modules)
Red Hat's Cockpit gives you a web UI per host with system state, services, containers, storage, and updates. It's not a fleet dashboard out of the box, but with multi-host configured, it works for small clusters.
Strengths:
- First-class system management (services, updates, storage).
- Light to install on each host.
- Integrates with systemd cleanly.
Weaknesses:
- App-level health is not its strength; this is more of a host-management UI.
- Cross-host overview is limited.
- Alerting needs to be wired separately.
When it's the right pick: you want system management more than app uptime, and you're already on Fedora/RHEL/Debian where Cockpit fits naturally.
Checkmk Raw (free edition)
The heaviest option on this shortlist. Full monitoring suite with agents, host views, services, metrics, and alerting. Free Raw edition is genuinely capable for small fleets.
Strengths:
- Real metric history, not just status.
- Powerful alerting and notification rules.
- Scales up if your needs grow.
Weaknesses:
- Significantly more to learn than the others.
- Installation is heavier — a real appliance, not a single container.
- The full UI surface can feel overwhelming for small setups.
When it's the right pick: you suspect you're going to outgrow Kuma within six months and want a tool that grows with you.
Decision shortcut
If you're starting today and just want to make a choice:
- Under 10 monitors, want a status page: Uptime Kuma. Stop reading.
- Several VPSes, want resource and uptime in one: Beszel.
- Mostly system admin (services, updates): Cockpit.
- Will need metric history within six months: Checkmk Raw.
- Want to compose your own: Glances + a script.
Most setups land at Uptime Kuma. It's the default for a reason.
What none of these are
None of the tools in the calm middle are full observability suites. They don't give you distributed tracing. They don't give you long-term metric history with high cardinality. They don't give you log aggregation. They aren't trying to.
The trade is that you get the answer to "is anything broken?" in one page, with very little setup overhead. If you need more — actually need it, not theoretically — then the right move is Prometheus + Grafana + Loki + Alertmanager, with the expectation of running that stack as its own ongoing project.
For most homelab and small-VPS operators, the trade is correct. The calm middle is enough.
What the wrong tool feels like
A few signs you've picked the wrong layer.
Too thin. You learn about outages from your users. Your uptime tool noticed but didn't alert you usefully. Either upgrade the alert channels or upgrade the tool.
Too thick. You spend an hour a week maintaining the monitoring stack itself. Reduce scope or swap to a lighter tool.
False positives. Alerts fire constantly without real outages. Either the checks are too aggressive (lower the frequency, raise the threshold) or the dependencies are flaky (add maintenance windows or change what you're checking).
Underused. The dashboard exists but nobody looks at it. The signal isn't reaching anyone. Wire the alerts into a channel the operator actually reads.
When any of these happen, the fix is usually to swap layers — not to add more configuration to the wrong tool.
Common alert channels worth wiring
Whatever tool you pick, the alerting destination matters more than the dashboard.
ntfy. Push notifications without an account. Free, fast, runs on a self-host server if you want.
Telegram or Discord. Free, fast, you're probably already in those apps.
Email. Reliable, but slow. Good for non-urgent.
Slack. Fine if your team is on Slack. Otherwise overkill.
Phone call (PagerDuty, Opsgenie). Only if you have on-call rotations.
A mix is usually right: ntfy for everything, email as backup, escalation to phone only for critical.
A short setup checklist
For any of the tools in the shortlist:
- Run the container (one Compose file).
- Add a monitor for each app — start with HTTP checks on the public URL.
- Add an alert channel (ntfy or email or Discord).
- Send a test alert.
- Add a maintenance-window for planned deploys.
- If you have multiple hosts, install the agent on each.
- If you want a public status page, configure it.
- Verify the dashboard URL is reachable from your phone (you'll want it there).
With this list checked, the dashboard is doing the job. Look at it once a day, react when it alerts, and ignore it the rest of the time. That's the calm middle.
The summary
The gap between shared hosting and a full Prometheus stack is real. The calm middle is filled by a small number of single-dashboard tools — Uptime Kuma being the default, with Beszel, Cockpit, Glances, and Checkmk Raw covering specific cases. Pick the one that matches your fleet shape; wire alerts into a channel you actually read; don't try to make it do more than tell you whether your apps are okay.
From across the StoicSoft network
Hand-curated reads on the same topic from sister sites in the StoicSoft family.
 Deploy to VPS6 min read
When a Budget Homelab Beats a Pile of Small VPS Bills — and When It Doesn't
Beginners are swapping $5/month VPS instances for one mini PC running a mixed stack. Sometimes that's smart, sometimes it just moves the cost to your time. How to decide.
Read on deploytovps.com Deploy to VPS6 min read
Self-Hosted Runbooks Fail When One Person Owns the Config Behind the 2am Page
Your homelab's bus factor is one, and that one is asleep at 2am. How to write runbooks and share access so a service outage isn't a single-person emergency.
Read on deploytovps.com Deploy to VPS6 min read
Family Self-Hosters Need a Backup and Rollback Preflight Before Every App Upgrade
When the household depends on your server, a bad upgrade isn't a hobby setback — it's everyone's photos and files down. A two-minute backup-and-rollback preflight before you hit update.
Read on deploytovps.com