Homelab hardware monitoring needs host-fault alerts before services start crash-looping
When a homelab operator lost two CPU cores, the first sign wasn't a hardware alert — it was Nextcloud crashing in a loop. This post walks through the layers of monitoring you need to catch host-level faults before your services become the canary.

When a homelab operator lost two CPU cores, the first sign wasn't a hardware alert — it was Nextcloud crashing in a loop inside an LXC container, dumping logs, crashes, and snapshots until someone noticed something was wrong. That backwards diagnostic order — app failure before host failure alert — is a common homelab trap, and it's worth building your monitoring stack specifically to prevent it.
Why services fail before hardware alerts fire
Most homelab setups grow monitoring from the top down. You add Uptime Kuma to watch your services, maybe a Grafana dashboard for CPU graphs, and call it done. The problem is that host-level faults — dead CPU cores, degraded RAM, a failing NVMe — don't always produce an obvious signal on their own. The kernel keeps running. The hypervisor keeps scheduling. Proxmox reports the node as healthy. Then an LXC that depends on memory bandwidth starts misbehaving, and your first alert is a container restart loop rather than a hardware warning.
The Nextcloud example is instructive. An LXC workload that does a lot of I/O and memory operations is exactly the kind of workload that will surface dead CPU cores through abnormal behavior, not through a clean kernel panic. By the time the logs are full of crash dumps, the underlying hardware has been broken for a while. You've lost the window where you could have responded proactively.
The fix is to instrument the host layer first, and wire its fault signals into the same alerting pipeline your service monitors use.
What host-level monitoring actually covers
Host-level monitoring is different from service monitoring. Service monitoring asks "is Nextcloud responding?" Host-level monitoring asks "is the machine that runs Nextcloud in a state where it can reliably run anything?"
For a Proxmox-based homelab, that means tracking:
- CPU core health — not just utilization, but whether all expected cores are online and contributing normally. A sudden drop in available threads or an unusual scheduling imbalance is worth alerting on.
- Memory fault detection — ECC error counters if your hardware supports it, or at minimum tracking whether the available memory pool matches expectations. Silent memory corruption is rare but catastrophic.
- Storage health — SMART data for drives, especially reallocated sector counts and pending uncorrectable errors. A drive heading toward failure usually telegraphs it in SMART data weeks before it dies.
- Container and VM restart counts — not just "is the service up" but "how many times has this container restarted in the last hour." Frequent restarts without external cause are a host-level signal, not just an app-level one.
- Thermal and power events — throttling events, unusual CPU temperature trends, and unexpected reboots all show up at the host layer before they affect application behavior.
The goal is to have a signal path where host fault → alert fires before host fault → app misbehaves → app alert fires.
Building the alert pipeline across layers
A practical homelab NOC for a multi-node Proxmox setup needs to think in layers. The builder designing a mobile-first NOC around Proxmox nodes, Linux hosts, Docker containers, SSL/domain expiry, storage history, and recovery visibility had the right mental model: each of those is a distinct layer, and alerts need to flow through all of them in a way that gives you causal context, not just a pile of notifications.
Here's a layering approach that works:
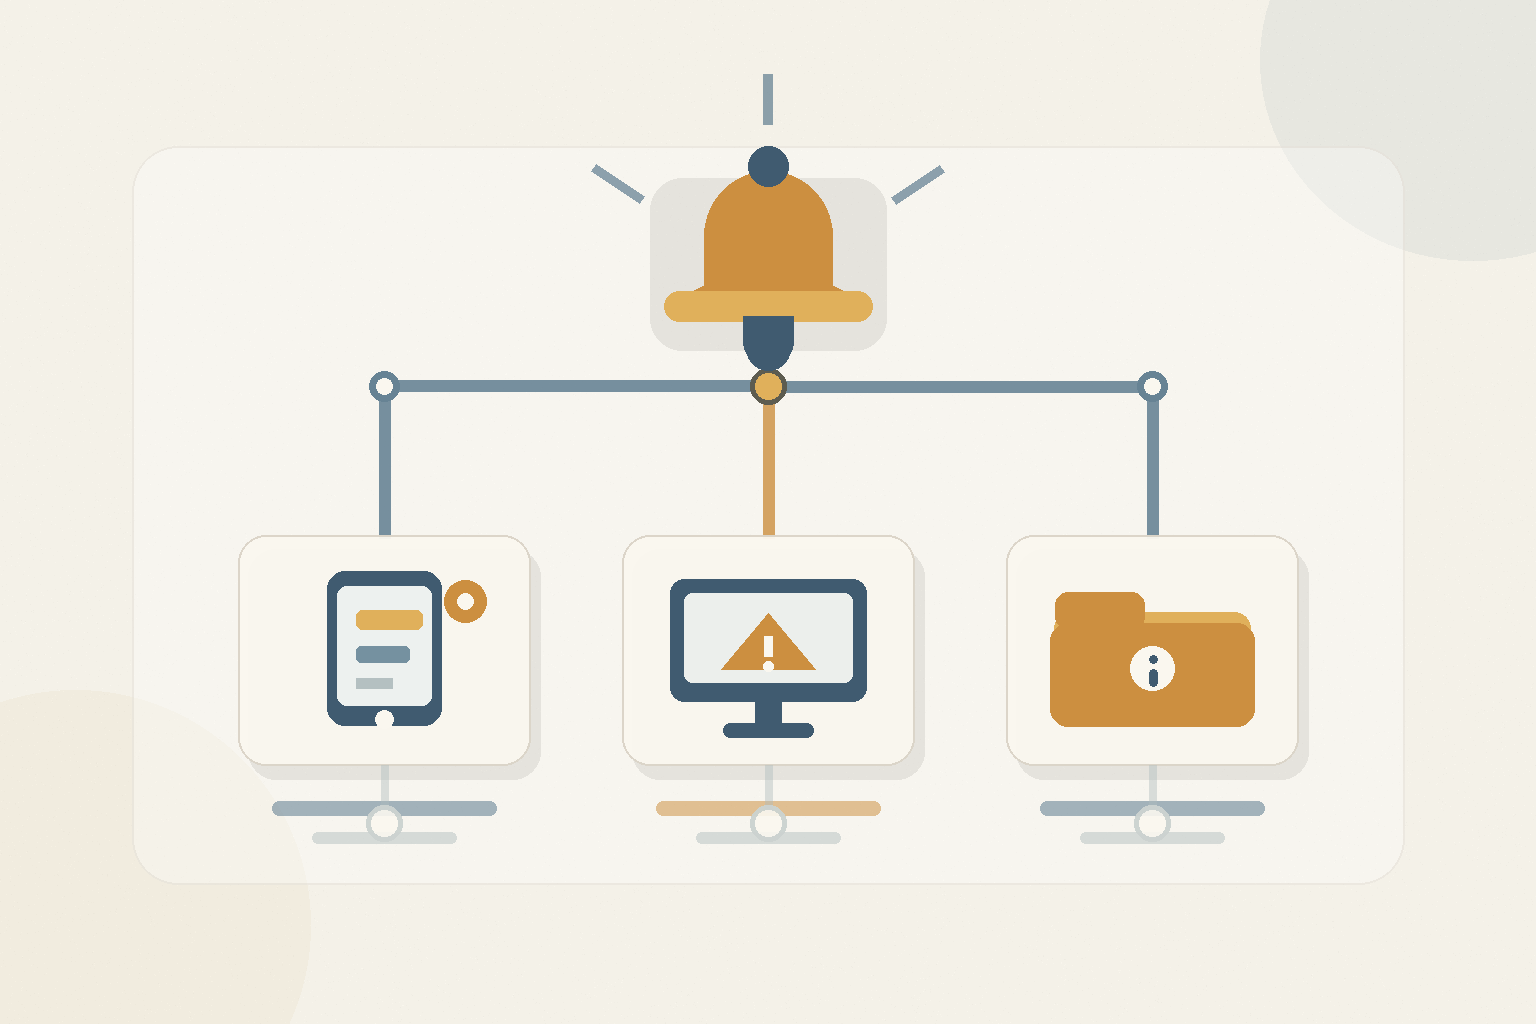
Layer 1: Host health — Use node_exporter (Prometheus) or a tool like Netdata on each Proxmox node. Collect SMART data via smartd or smartmontools. Alert on ECC errors, SMART thresholds, CPU core count changes, and sustained thermal throttling. These alerts should be your highest priority — they indicate the platform is unreliable.
Layer 2: Hypervisor and container runtime — Proxmox's own API exposes VM and LXC state. A restart loop shows up here before it shows up in your service monitor. Wire container restart frequency into your alerting system. If a container restarts more than three times in thirty minutes without a manual trigger, that's an alert-worthy event.
Layer 3: Service availability — Traditional uptime checks (HTTP, TCP, ping) live here. Tools like Uptime Kuma or Gatus work well. These are useful but should be the last layer you add, not the first.
Layer 4: Application-layer signals — Log aggregation, error rate tracking, and response time histograms. Useful for diagnosing the nature of a problem once you know a problem exists.
The key is that alerts from Layer 1 and Layer 2 should be wired into the same notification channel as Layer 3 — and they should carry enough context that you can see "CPU core went offline → Nextcloud LXC started crash-looping → Nextcloud HTTP check failed" as a single incident rather than three separate noise events.
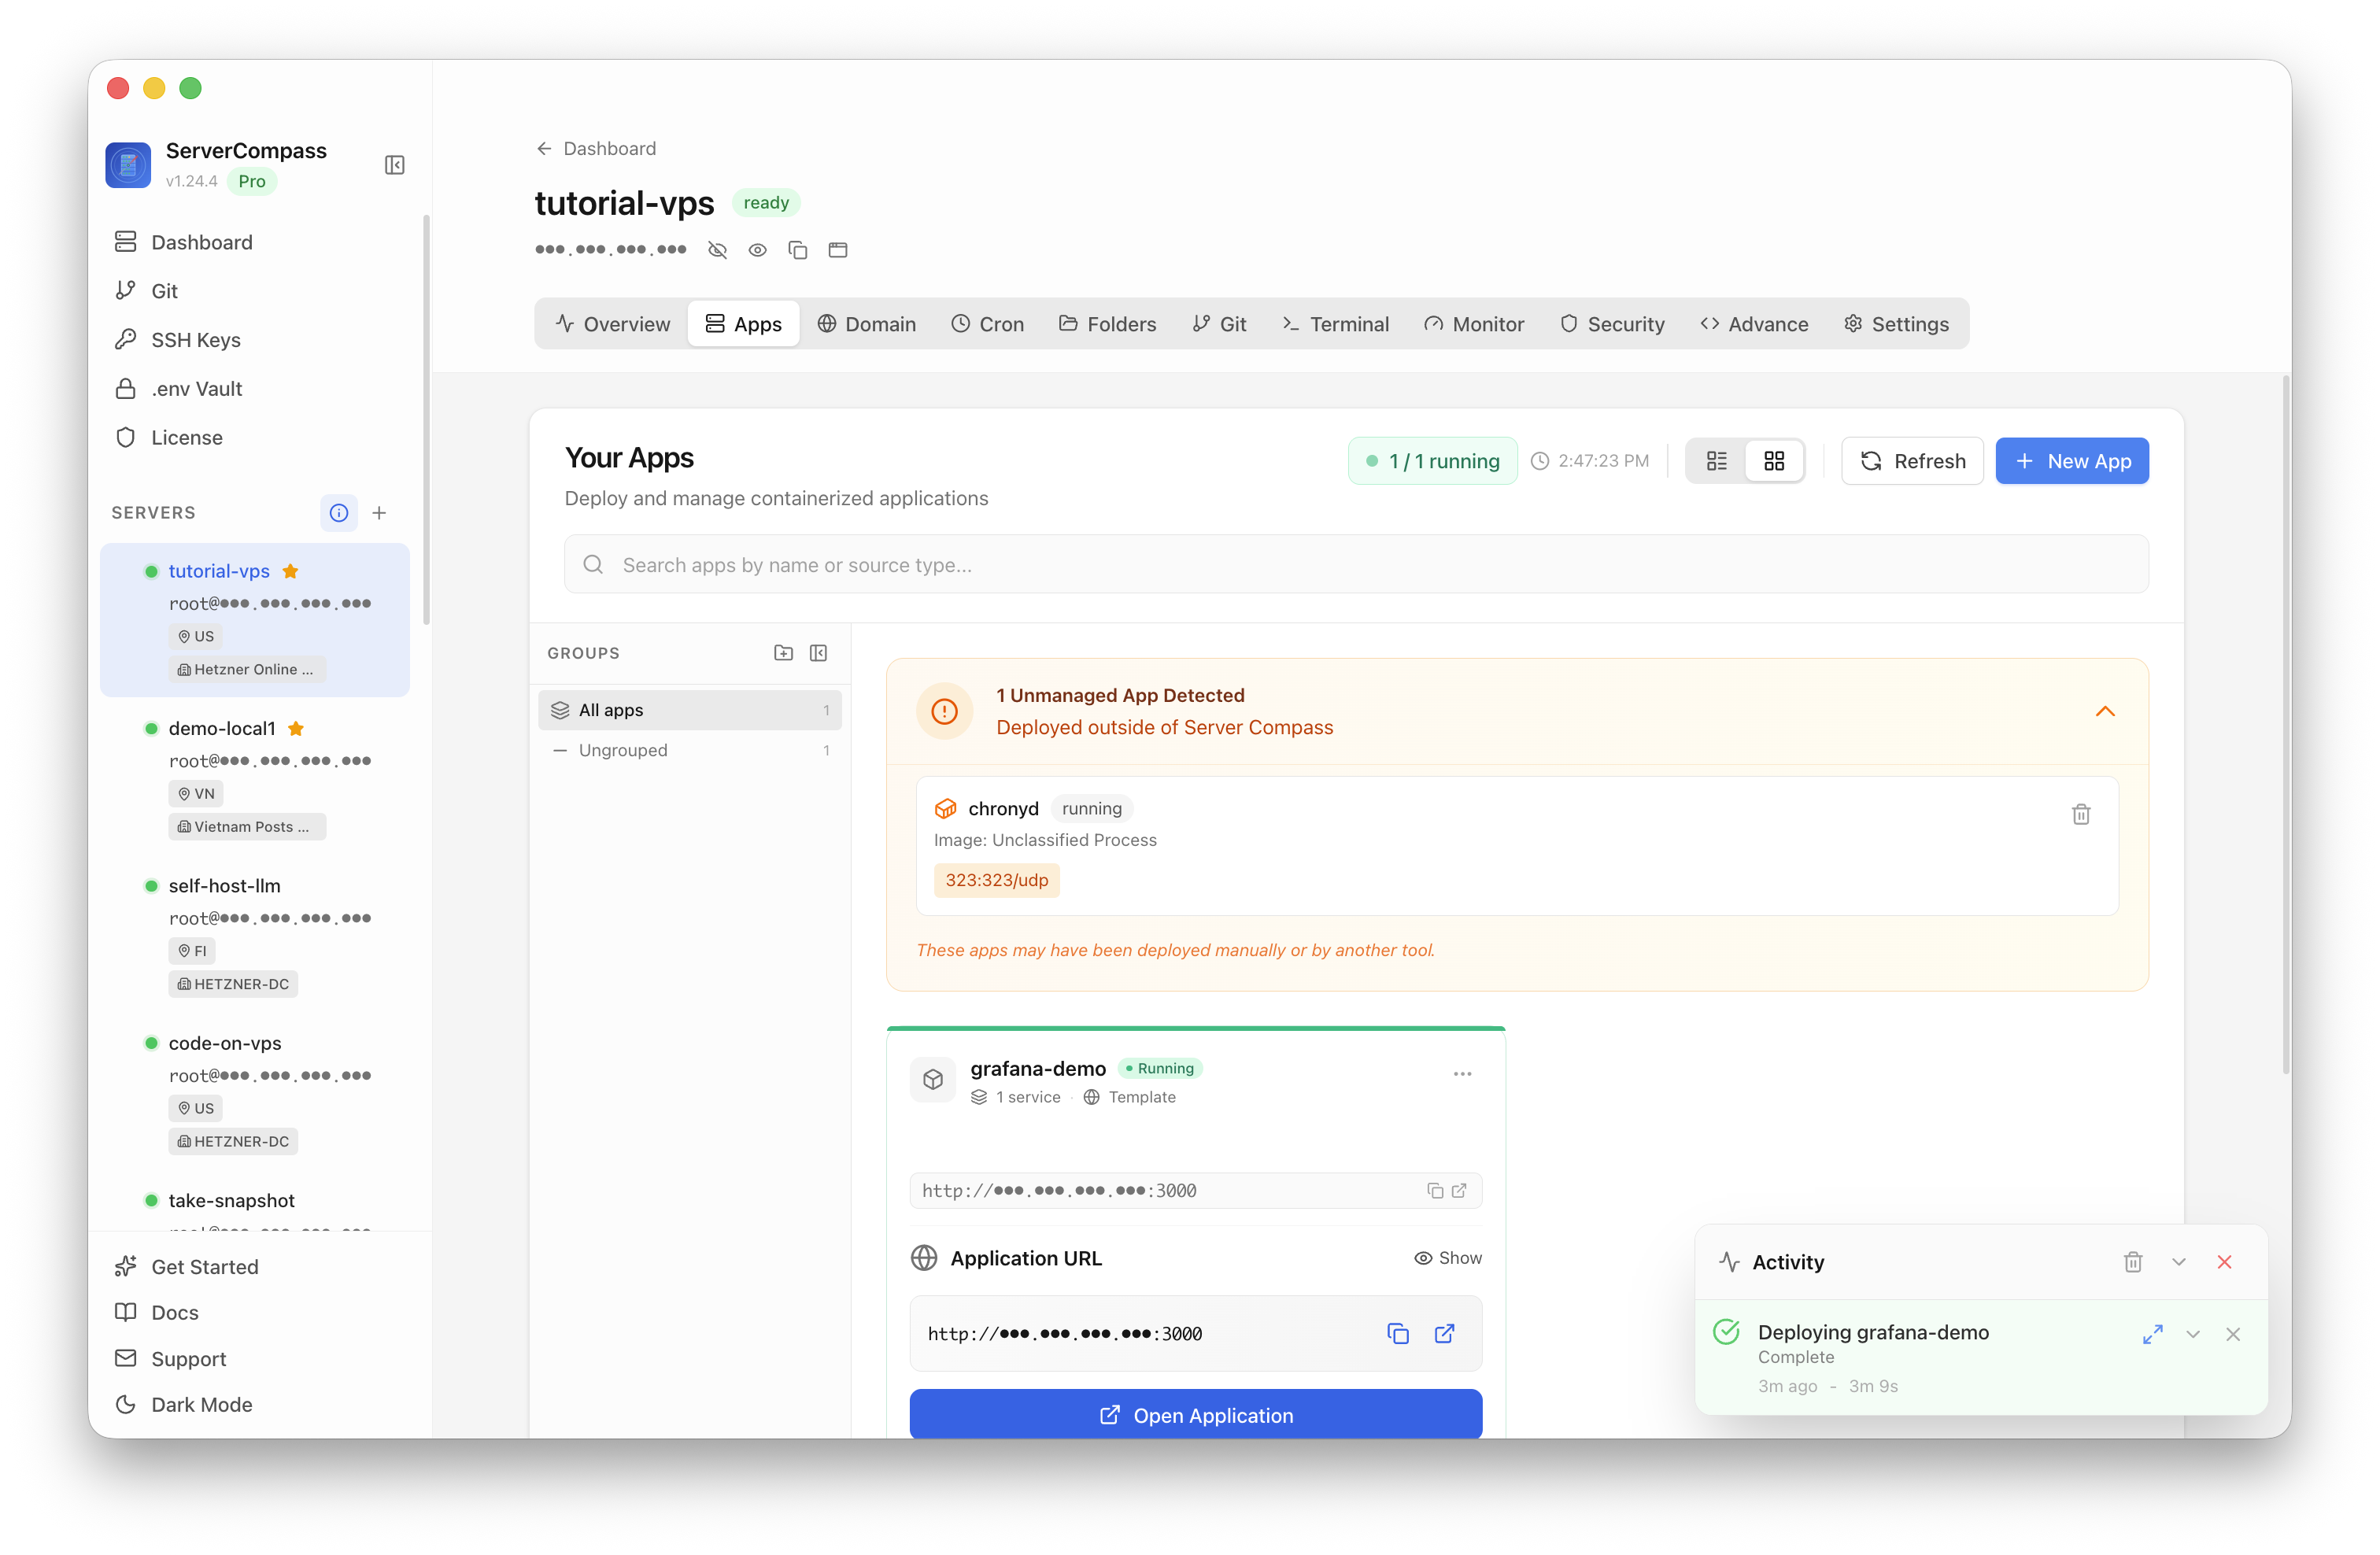
Tools like ServerCompass give you a unified view of running services, storage status, and SSL expiry across your nodes, which helps with the correlation problem — you can see service state and host context in the same place instead of switching between four dashboards.
Recovery visibility matters as much as fault detection
One failure mode that monitoring guides underemphasize: knowing when recovery is complete. A Home Assistant user had an add-on update stuck for hours and was waiting to restore from backup. The problem wasn't just that the update failed — it was unclear when it was safe to intervene, and whether a partial restore had succeeded.
Recovery visibility means:
- Backup job completion alerts, not just backup failure alerts. Know when your last good backup was taken, not just when a backup failed.
- Restore verification — after a restore, run a basic smoke test to confirm the service is actually functional, not just that the restore process exited zero.
- Stuck process detection — a process that hasn't progressed in N minutes and hasn't exited is worth alerting on separately from a crashed process.
- Clear "all clear" signals — your monitoring system should tell you when a node returns to a healthy baseline after a fault, not just when the fault started.
Most homelab setups have decent fault detection and poor recovery visibility. The gap leaves operators in the position of manually poking at systems to figure out if they're actually healthy again.
Checklist
- Add host-level monitoring (node_exporter, Netdata, or similar) to every Proxmox node before relying on service-level uptime checks
- Collect SMART data for all drives and alert on key thresholds (reallocated sectors, pending uncorrectable errors, temperature spikes)
- Track container and LXC restart frequency — more than 2-3 restarts per hour without a manual trigger should fire an alert
- Wire host-layer alerts into the same notification channel as service alerts so you can see causal chains, not isolated events
- Monitor CPU core count and memory pool size for unexpected changes that don't produce an obvious kernel error
- Set up backup completion alerts (not just failure alerts) and know the timestamp of your last verified good backup at all times
- Add stuck-process detection for long-running jobs like updates, migrations, and restores
- Use a unified dashboard (such as ServerCompass) to correlate service state with host health without switching between multiple tools