How to Read a VPS Provider's Status Page (And What to Ignore)
The status page is the single most underused signal in VPS provider evaluation. The 90-day skim, what to look for, and what to weight elsewhere.
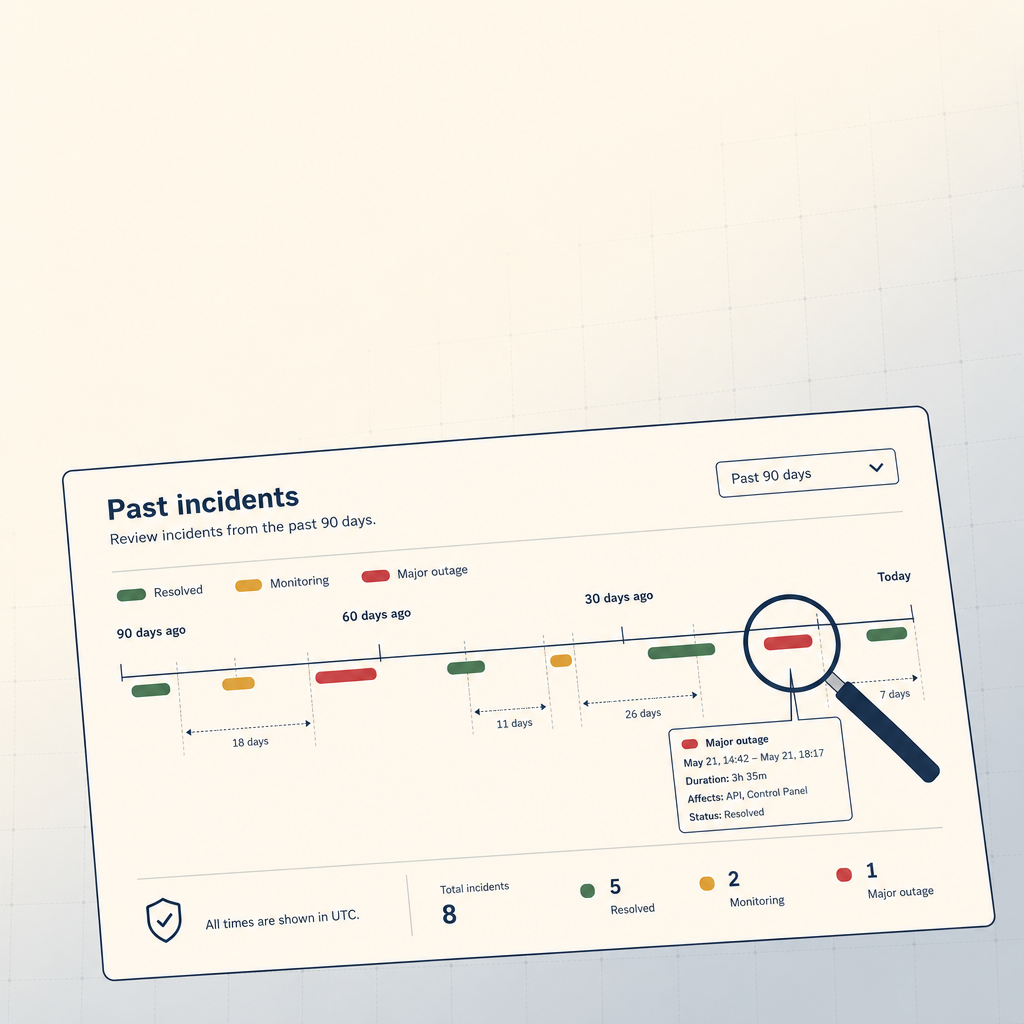
Every reputable VPS provider publishes a status page. Almost no one knows how to read one.
The status page is the single most underused signal in VPS provider evaluation. Pricing is loud and uniformly underestimates risk. Benchmarks are loud and uniformly overestimate stability. The status page is quiet — and it's the only place that tells you what the provider is actually like to live with.
This is how to read one.
What status pages can tell you
Five things, in order of usefulness:
- How often things break — incident frequency over the last 90 days.
- How long things stay broken — mean time to recovery (MTTR), implied or stated.
- What kind of things break — networking? compute? control plane? a specific region?
- How honest the operator is — are full-region outages reported? Are partial degradations downplayed?
- How quickly they communicate — first acknowledgement to user-facing message.
Skim past the green checkmarks. The bottom of the page — the historical incident list — is the only part that matters.
The 90-day skim
Open the provider's status page. Scroll to "Past incidents" and look at the last 90 days. Ask:
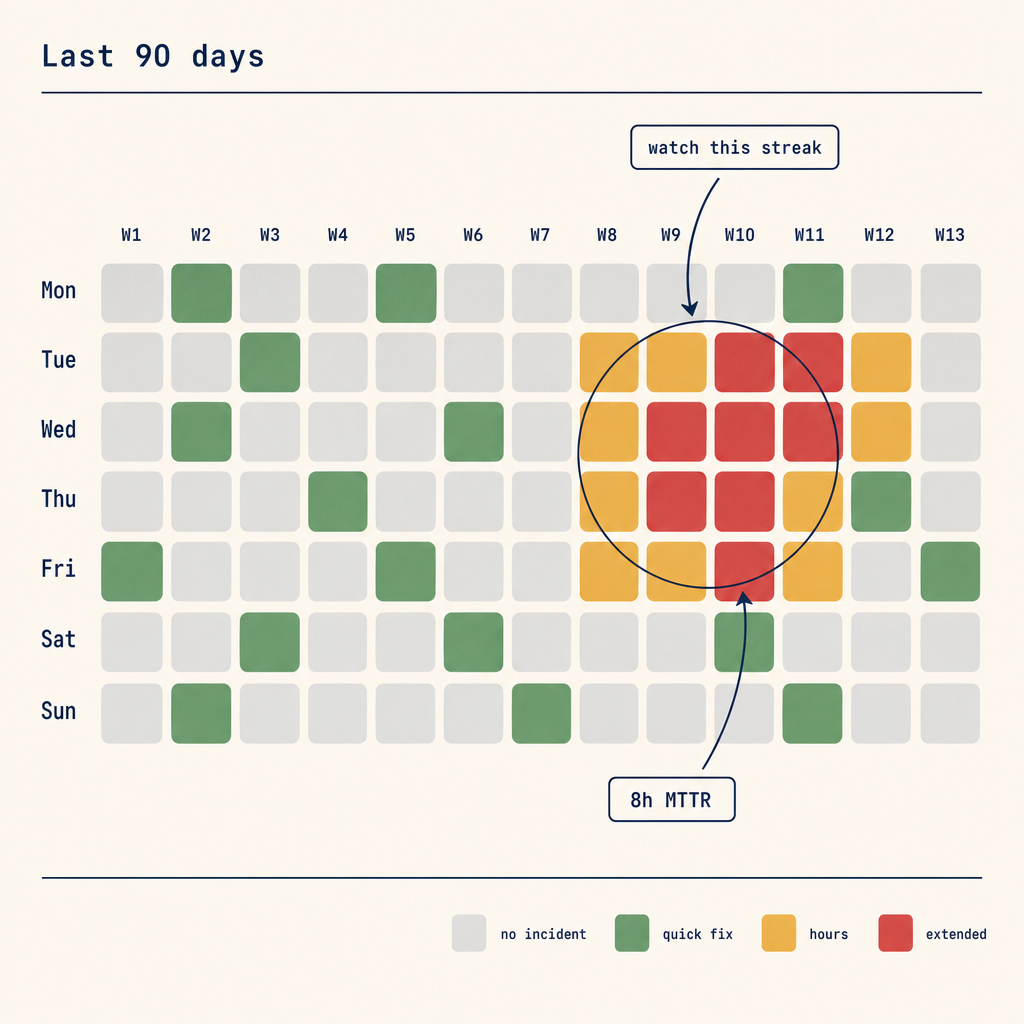
Do one pass for incident count, then a second pass for how long each item stays in "investigating" or "identified" before it reaches "resolved."
How many incidents are there?
A healthy operator publishes 3-15 incidents per quarter. Below 3 is suspicious — most providers have some hiccup in 90 days, and a clean status page often means they're not reporting them, not that nothing happened.
Above 30 is concerning if you're running production traffic. It doesn't necessarily mean the provider is bad; it might just mean they're large and report transparently. But it's a signal to weight against.
How long does an incident last?
Look for the gap between "Investigating" and "Resolved." Typical patterns:
- Under 30 minutes: well-run incident response, probably automated.
- 30 minutes to 2 hours: normal for routine incidents.
- 2-8 hours: serious. If most of their incidents fall here, expect the same when yours hits.
- >8 hours: chronic operational issues. Avoid for production.
Note that providers who don't acknowledge incidents until they're confirmed resolved (rare but they exist) will look fast on this metric while actually being slow. Cross-reference with HackerNews/Reddit for the same time windows.
What components are affected?
Status pages segment by component: compute, networking, storage, control plane, billing, support tooling. Two patterns to watch for:
- Networking-heavy outages: bad sign. Network problems cascade into everything and are usually the hardest to fix.
- Control plane outages: less catastrophic for already-running workloads, but blocks new deploys and scaling. If you scale frequently, this matters.
- Region-specific patterns: if every other incident is in a specific region, avoid that region. Pick a different one even on the same provider.
What's missing from the page?
Some providers don't publish:
- IPv6-only outages (look for forum complaints during the same windows)
- Email/notification delivery delays
- Provisioning queue backups (you can't spin up a new server)
- Billing/invoicing issues
These are real outages from a customer perspective. If a provider only reports "connectivity to compute" and ignores everything else, their reported uptime is misleadingly high.
What status pages can't tell you
Three things you have to look elsewhere for:
1. The post-incident response quality
Status pages report incidents. They rarely report what changed afterward. Good operators write public post-mortems on their blog or status RSS for major incidents — that's where you learn whether they actually fix root causes or just clear the alert.
For each major incident in the last 90 days, search for "{provider name} post-mortem" or "{provider name} {incident date}". A provider with no post-mortems for serious incidents is opaque. Weight accordingly.
2. The blast radius they don't report
A "performance degradation" on a status page can mean anything from "10ms latency increase for 0.1% of customers" to "everyone's site is throwing 503s for half the region." The page rarely says which.
Cross-reference with social signals: if HackerNews has a thread complaining about the provider on the day of a "performance degradation," the impact was real and large.
3. Repeat customer behavior after incidents
The strongest signal of all is whether their largest customers stay or leave after a bad incident. You won't see this on the status page, but you will see it in:
- Public AWS/cloud cost case studies that mention prior providers
- Hiring patterns ("looking for SRE experience with $provider migration")
- Provider's own customer list — does it churn between 90-day snapshots?
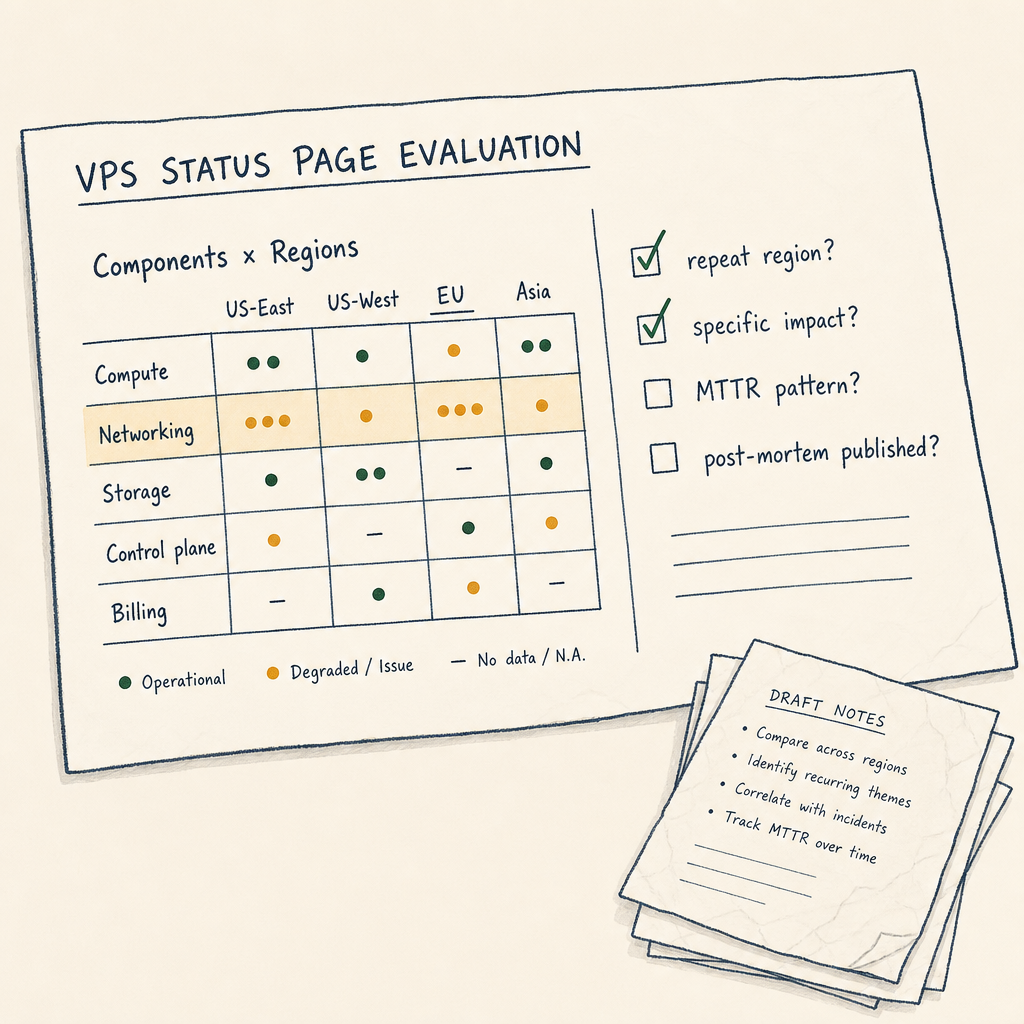
When you compare providers, note which components fail repeatedly, whether the same region keeps reappearing, and how specific the provider is about customer impact.
A short field guide
Hetzner
Tends to report all incidents promptly. Networking outages happen but recover in under an hour. Major outages are rare but real (the 2024 Falkenstein incident is still discussed). Public post-mortems are minimal.
DigitalOcean
Status page is honest about regional issues but downplays control-plane glitches. Provisioning delays during major signups (e.g. announcement-driven traffic) are not always reflected. Otherwise reliable.
Vultr
Status page covers compute and networking well. Less transparent about pricing/billing changes (which are real outages from a customer perspective). MTTR is good when issues hit.
OVH
European data centres have a long history; status reporting is detailed but the sheer scale means more incidents land on the page. Not a quality signal — just volume.
Linode (Akamai)
Post-acquisition, status page rigor has stayed high. Incidents are reported; recovery times are reasonable.
Smaller providers (Clouvider, Servarica, Hivelocity, etc.)
Status pages exist but are often manually updated. If the page hasn't shown an incident in 6 months, it's almost certainly stale, not perfect.
The operational read
When you're choosing between two providers at similar price points, the status page audit is faster and more honest than a benchmark suite. Spend 10 minutes on each provider's "Past incidents" page. The patterns will tell you which provider's pager you'd rather inherit.
A provider with weekly small incidents and 30-minute MTTR is almost always better to live with than a provider with one big quarterly outage that took 8 hours to recover. The first profile is operationally mature. The second is operationally fragile.
When to weight status pages less
For workloads that don't care about the kind of issues a status page reports:
- Backup-only or cold-storage workloads — short outages don't matter; what matters is data integrity.
- Dev/staging environments — you can tolerate occasional weirdness.
- Workloads behind a CDN with cached content — the origin can flap and users won't notice.
In those cases, price and feature-set dominate. For anything user-facing or transaction-handling, the status page is the dominant signal.
Closing principle
Pricing pages are marketing. Benchmarks are a snapshot. Status pages are the only part of a VPS provider's website that's allergic to lying — because their existing customers would notice.
Read them.
Related in the StoicSoft network
If you run monitoring, uptime checks, or alerting across self-hosted apps like the ones above, ServerCompass is the StoicSoft network's tool for wiring tiered severity, flap suppression, and low-noise alerts into a single dashboard.
From across the StoicSoft network
Hand-curated reads on the same topic from sister sites in the StoicSoft family.
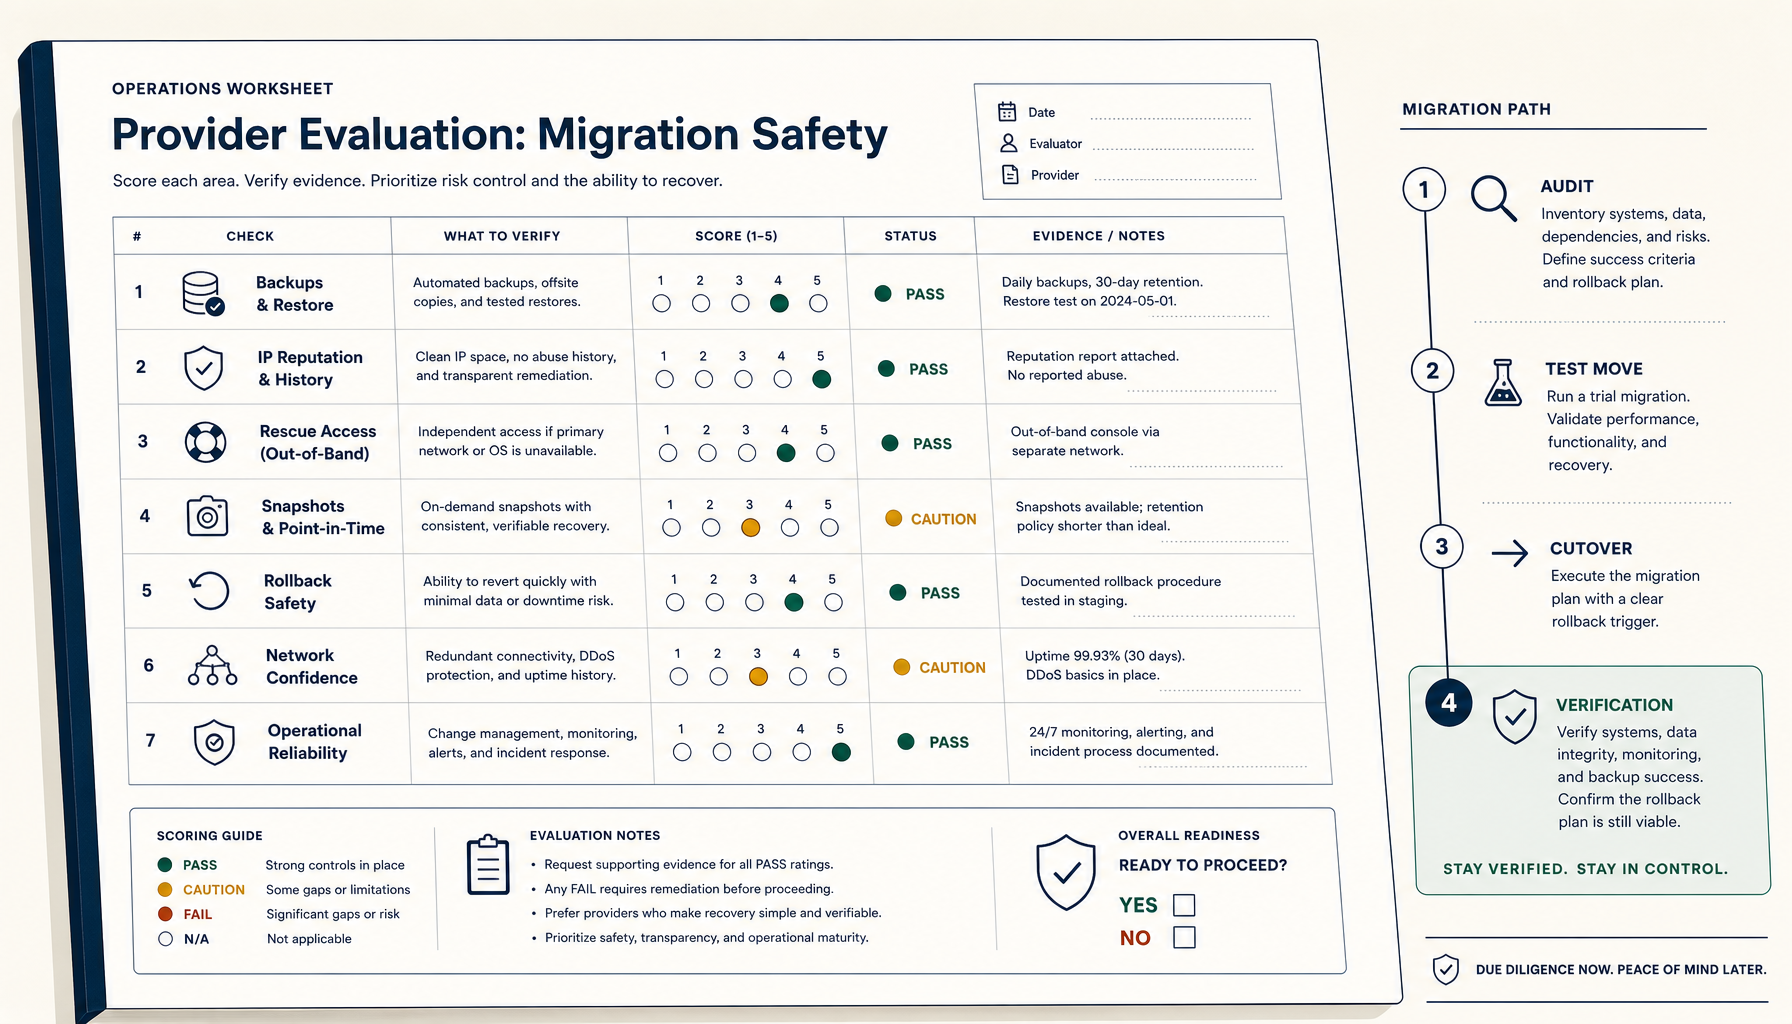 Deploy Handbook9 min read
How to Evaluate a VPS Provider for Migration Safety (Not Just Price)
Most VPS migration disasters trace to the workflow, not the destination. The seven verifications and four-phase migration playbook.
Read on deployhandbook.com Deploy to VPS20 min read
How to Deploy a Docker App to a VPS (From Image to HTTPS)
Deploy any Docker image to a VPS with HTTPS, persistent volumes, and a repeatable workflow. The foundation for everything else.
Read on deploytovps.com